
Why the most accurate AI models are still lying
Five charts to start your day


For $10 a month, or $100 a year, you support a simple mission: spread great data visualisation wherever it comes from. You help fund the work of finding, sourcing and explaining the charts that deserve a wider audience. And you back a publication built on generosity, transparency and the belief that better understanding makes a better world.CHART 1 • Why the most accurate AI models are still lying
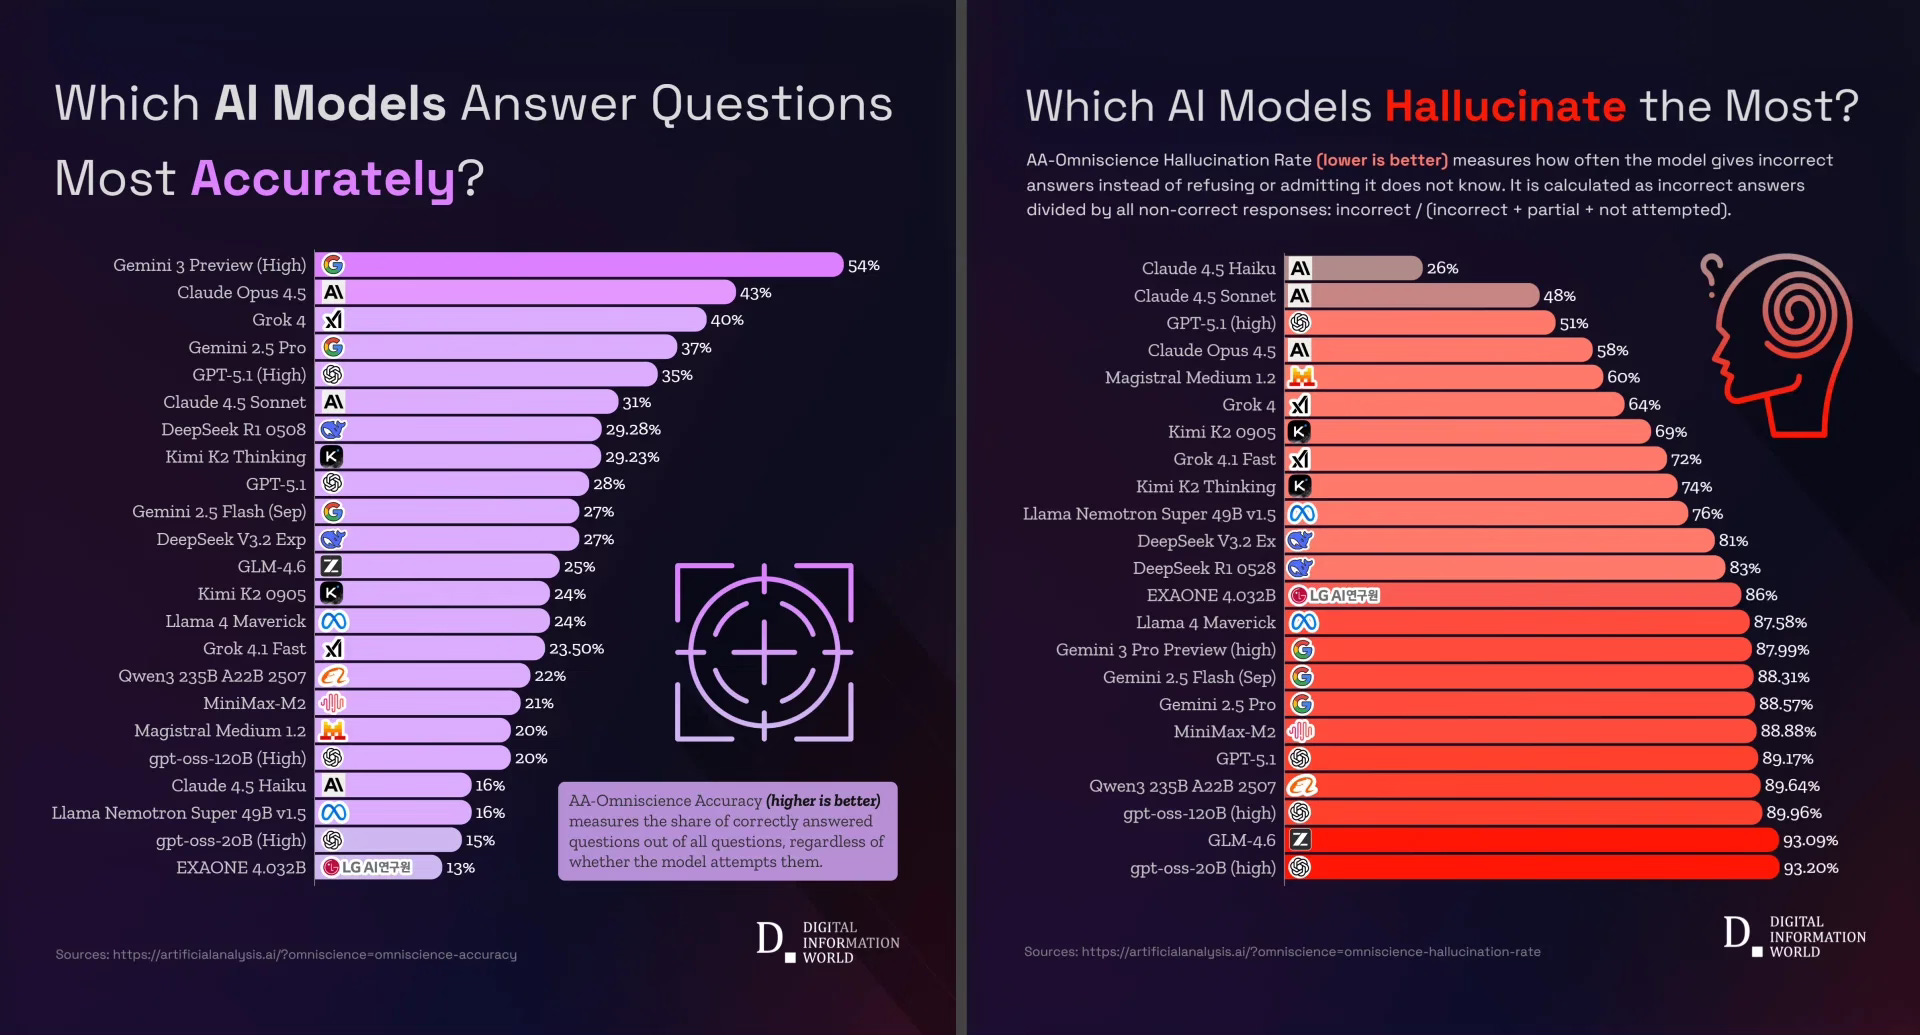
We naturally assume that higher intelligence equates to better reliability when evaluating artificial intelligence. New data reveals a fascinating paradox in how these systems actually operate. While Gemini 3 Preview secures the top spot with 54% accuracy, the detailed metrics suggest we should be careful about trusting it blindly.
These twin charts highlight a significant compromise in AI development. Gemini 3 Preview is incredibly capable and answers more questions correctly than its competitors. However, the second chart shows it possesses an 88% hallucination rate. This metric tracks how often the model fabricates an answer rather than admitting ignorance. Essentially, the model has been trained to be helpful above all else, which means it will confidently guess rather than decline a request it does not understand.
This creates a sharp contrast with models like Claude 4.5 Haiku. While that model only answers 16% of questions correctly, it has the lowest hallucination rate at 26%. This suggests a structural difference in how these models are optimised. Developers are constantly balancing the need for a system that attempts every task against one that prioritises factual safety. We are seeing a split between high performance engines that lack a safety filter and cautious models that are much more limited in scope.
Source: Digital Information World
We assume that higher intelligence means better answers. We see this most clearly in the new AI benchmarks where the smartest models are also the most prone to fabrication. They are optimising for a high score rather than factual truth. The corporate world mirrors this divergence. Oracle and Snowflake are posting impressive growth numbers on the surface while their cash flow and operating margins tell a story of intense capital burn and structural cost.
So what’s real, and what’s not? Are we all hallucinating?
I’ve got four more charts that expand on this story but they’re for paid subscribers. Consider joining if you want the full edition.
