
Why rearmament did not kill social spending
Five charts to start your day


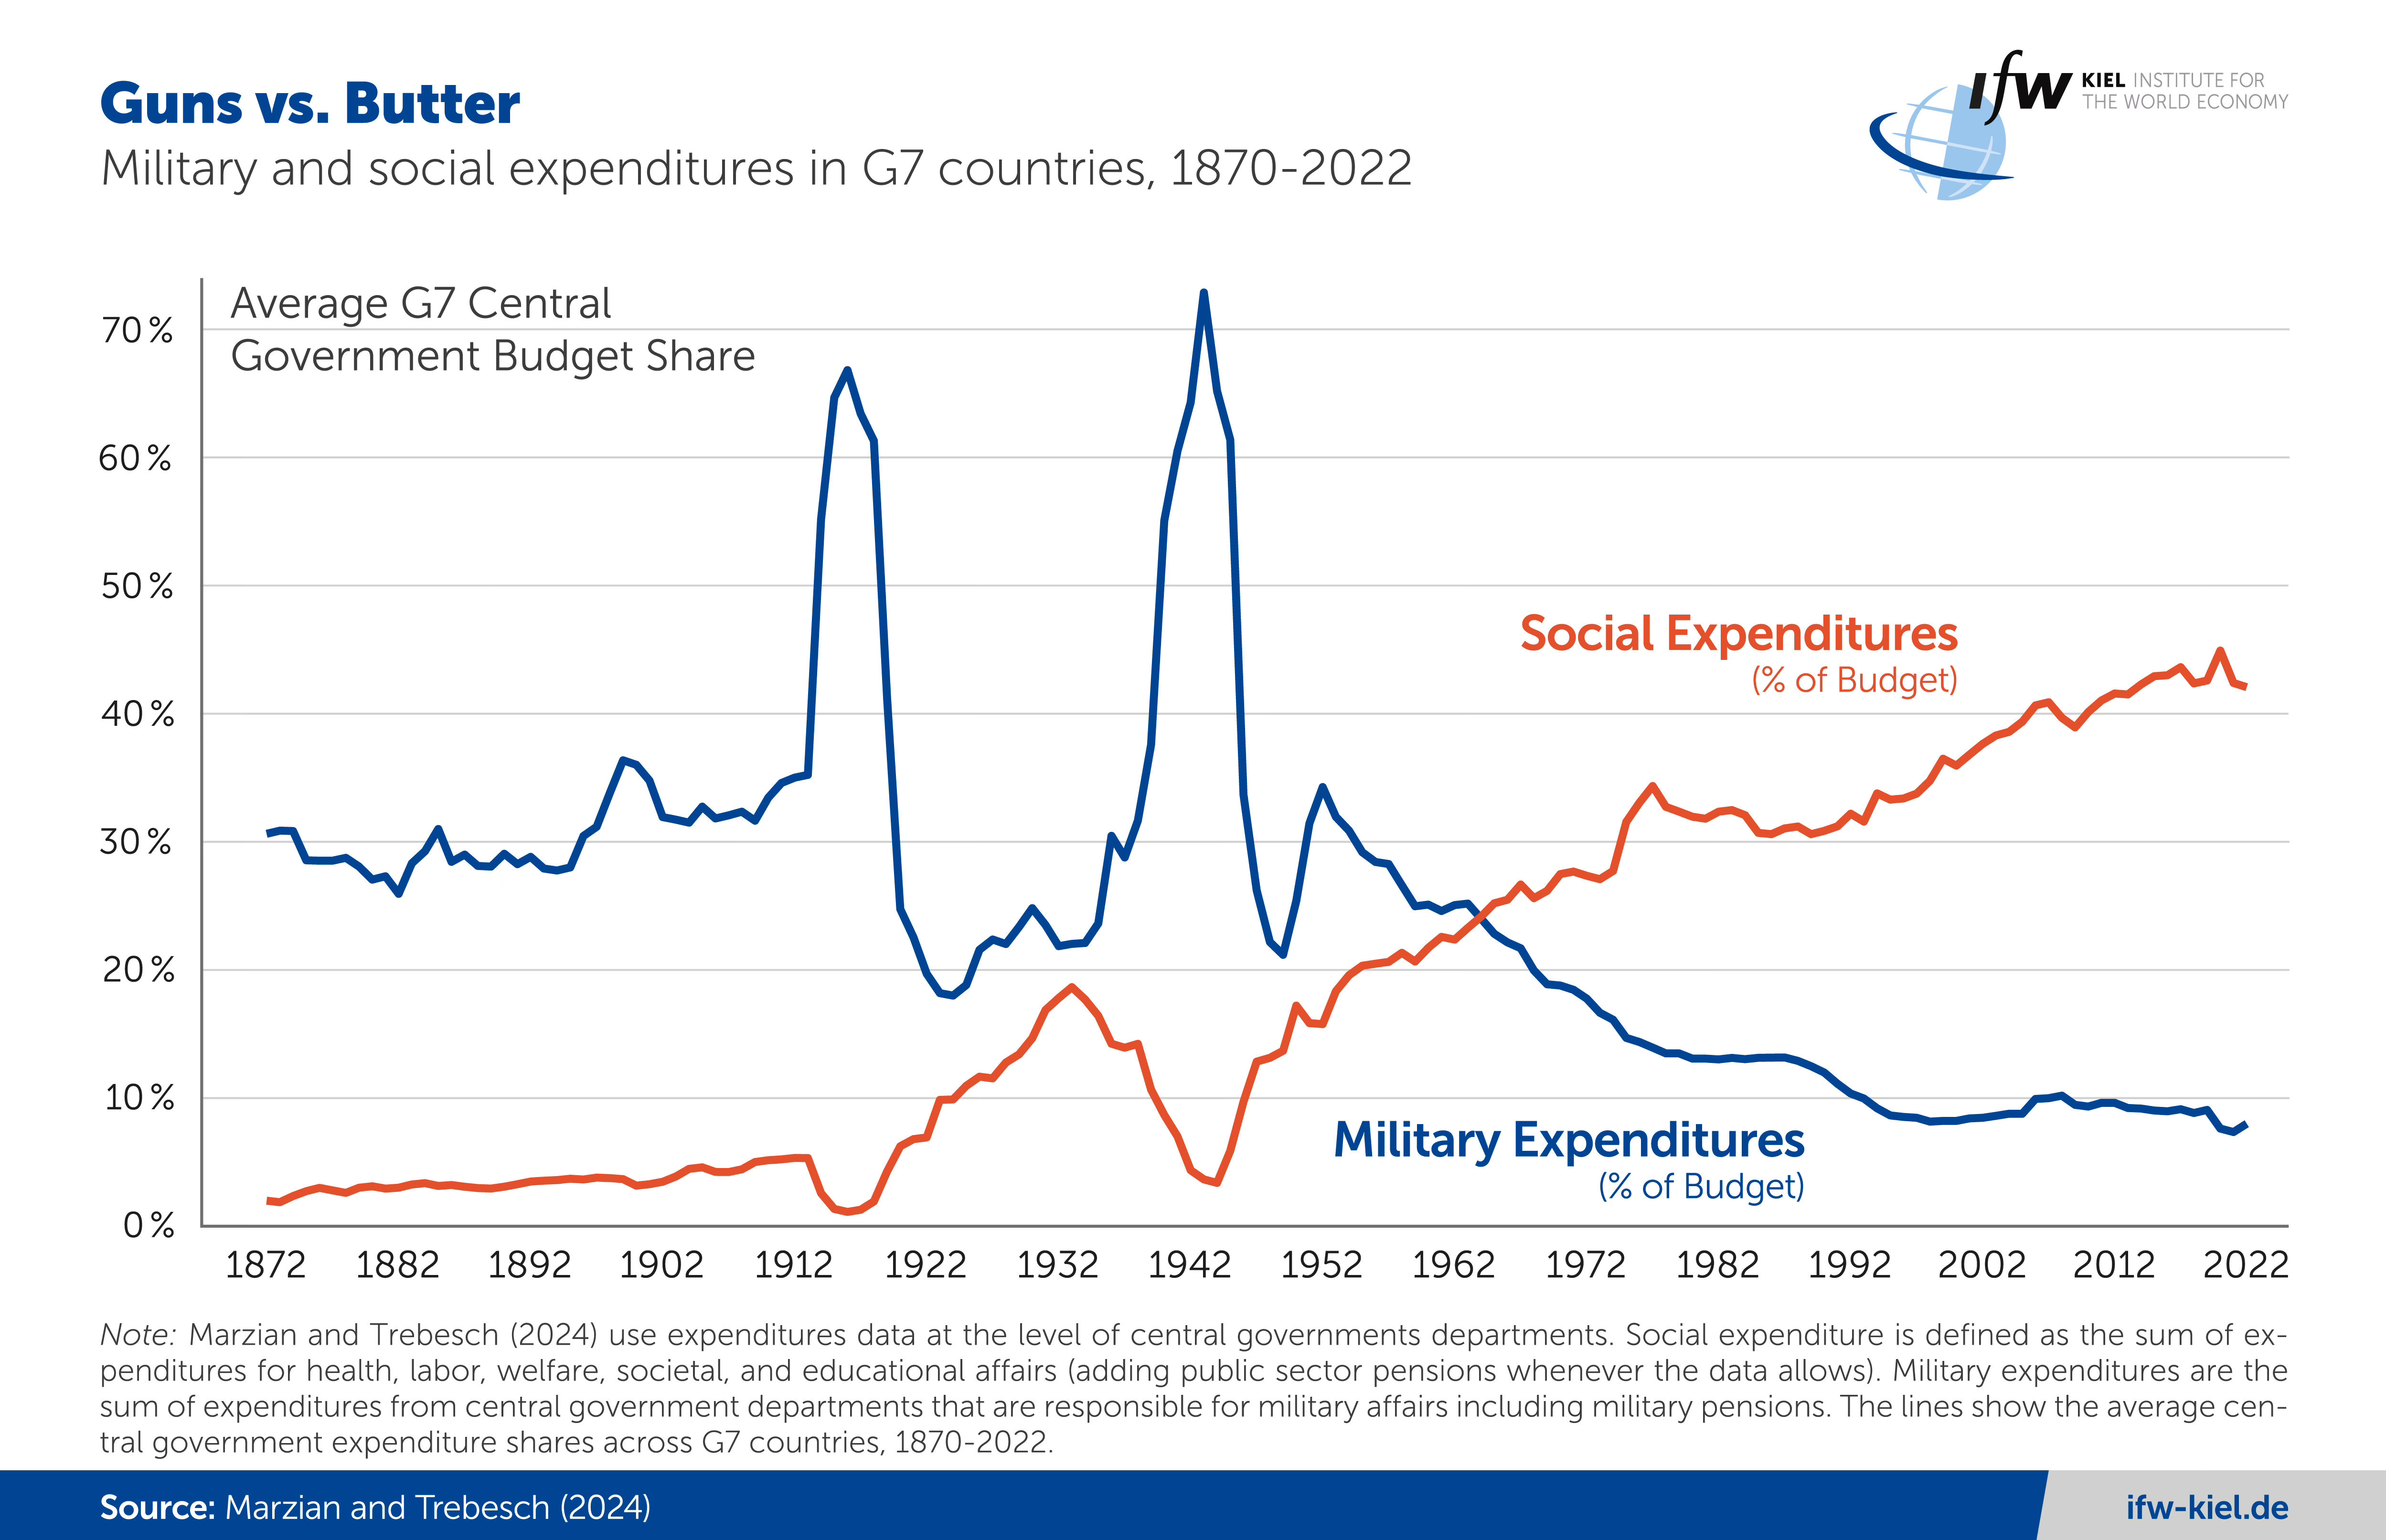
For $10 a month, or $100 a year, you support a simple mission: spread great data visualisation wherever it comes from. You help fund the work of finding, sourcing and explaining the charts that deserve a wider audience. And you back a publication built on generosity, transparency and the belief that better understanding makes a better world.CHART 1 • Why rearmament did not kill social spending
For all the old talk of guns versus butter, the long sweep of G7 history points somewhere less dramatic and more awkward. Military spending surged during the world wars, then steadily gave way to social spending over the post war era, until welfare, health, education and pensions absorbed a far larger share of the state than defence ever did. The bigger story is not a permanent trade off. It is the rise of a much larger state whose priorities changed over time.
That matters because the standard political argument still assumes that rearmament must mean dismantling the welfare state. The underlying Kiel research argues the historical record does not support that neat choice. Across major military buildups, governments more often financed higher defence spending through borrowing and, to a lesser extent, higher taxes, while cuts to social spending were the exception rather than the rule.
The uncomfortable implication for today is that Europe’s new security push may not be paid for by brutally simple spending swaps. History suggests the likelier outcome is a state that becomes dearer overall. In other words, the real question is not whether governments choose guns or butter. It is how much more debt, tax and fiscal strain voters will tolerate when they insist on both.
Source: Kiel Institut
People are told to choose between defence and welfare, tax and prosperity, saving and spending, democracy and disorder. Real societies are rarely that clean. They muddle through by layering promises, shifting costs and hoping institutions hold.
That is why charts like these are valuable. They force you to look past the performance of politics and into the machinery underneath. And once you see that machinery properly, a lot of comforting narratives start to look thin.
I’ve got four more charts that expand on this story, but they’re for paid subscribers. Consider joining if you want the full edition.
