
Why France can't fix its finances
Five charts to start your day


The French parliament sacked France's prime minister for suggesting people give up two public holidays to help fix the country's finances. The 364 to 194 vote against François Bayrou makes him the second French leader in nine months to fall for trying to cut spending. The audacity of suggesting workers sacrifice their sacred time off clearly failed.
Meanwhile, unions are planning what they're calling "historic" strikes, because apparently the one million people who flooded French streets last year over raising the retirement age from 62 to 64 wasn't quite historic enough. The irony is delicious: France now pays higher interest rates on its debt than Greece, the country that nearly broke Europe a decade ago.
The nation spends nearly a third of its GDP on social benefits, the highest rate in the developed world, and any attempt to trim even a fraction triggers massive resistance. When Macron raised the retirement age by two years, the protests lasted months, turned violent, and still enjoy majority public support. France has created a perfect trap: it cannot afford its spending, but it cannot afford to cut it either.
CHART 1 • Why France can't fix its finances
Look at the chart below. The fiscal nightmare keeps deepening. With debt approaching 120% of GDP and three government collapses in nine months, Europe's second largest economy is spiralling towards a reckoning that could shake the entire eurozone. The numbers are brutal: €3,346 billion in total debt, or €185 billion more than just a year ago. France now owes more relative to its economy than at any point since World War II, while Germany has methodically cut its debt burden to just 62% of GDP.
Markets are losing patience: French bond yields have climbed above those of Spain, Portugal and even Greece, countries once synonymous with eurozone crisis. Credit rating agencies are circling, with Moody's already cutting France's rating and warning that political fragmentation will likely prevent any meaningful fiscal consolidation for years to come. Bayrou's predecessor Michel Barnier fell last December for attempting similar spending cuts.
I found this chart fascinating because it mirrors Britain's recent turmoil remarkably closely. We've also churned through Prime Ministers at breakneck speed, faced relentless union action and been left grappling with mountainous debt.
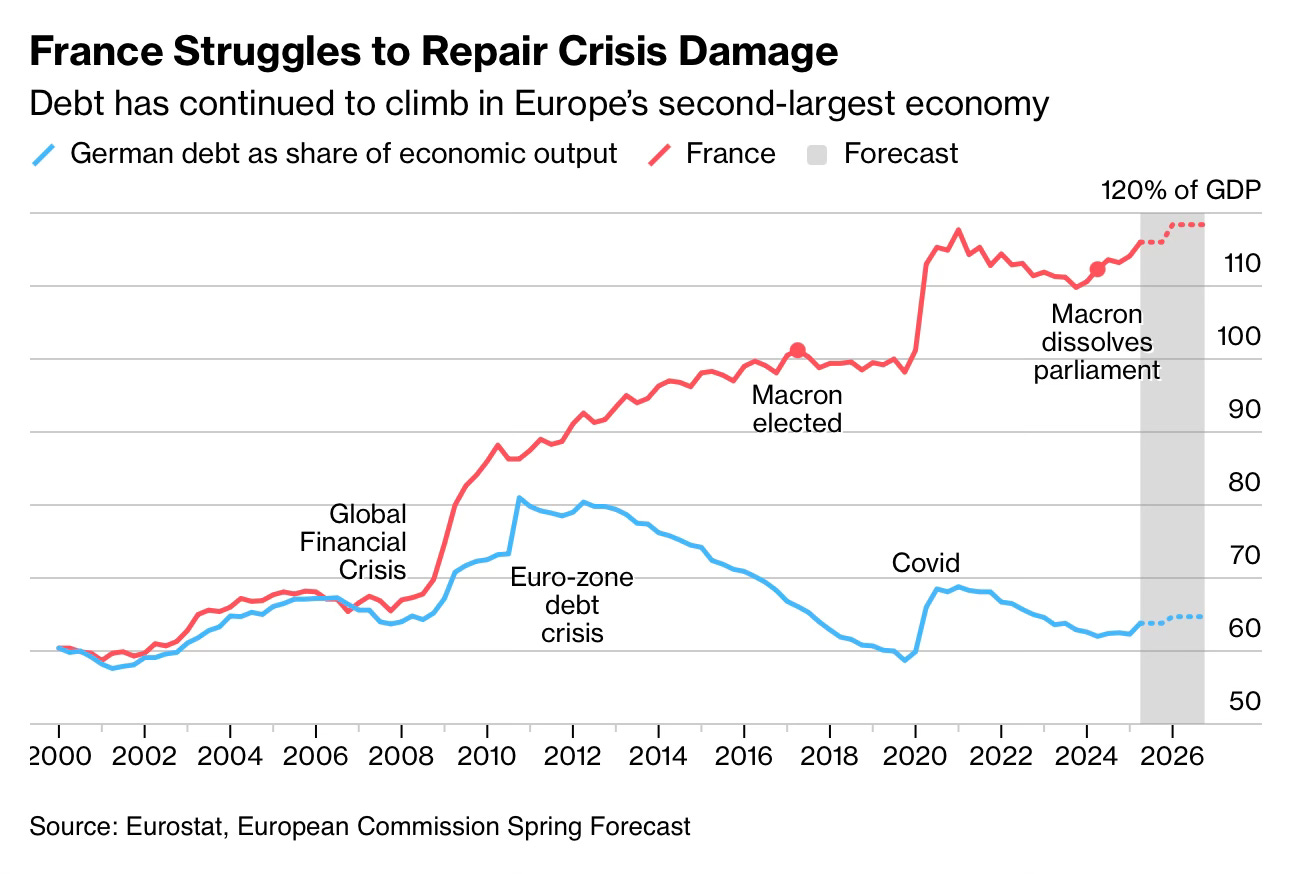
Source: Bloomberg
One of the reasons why this chart works so well is because of the labels. They add historic context and this is a very effective technique in data visualisation. I do this myself. It's a clever way to embed unstructured data (the labels) onto a chart. I have four more charts to share, but as always, you will need to be a paid subscriber to join.
