
We only call it a bubble after it bursts
Five charts to start your day


We only ever see the outlines of a bubble when we’re already inside it. The signs are there, the language softens, the optimism feels rational – until it doesn’t. The dot-com boom offered a clear example: journalists spoke of a “bubble” only after it burst. Today’s market, buzzing with AI-fuelled euphoria, may be setting the stage for another lesson in hindsight.
Chipmakers are the new standard-bearers of speculative faith. Their stocks have reached record highs, driven by the insatiable demand for computing power and the narrative of an “AI revolution.” Unlike the fibre-optic frenzy of the 1990s, this one comes with tangible infrastructure and extraordinary profits. Alphabet’s recent results show what happens when technology meets scale and relentless efficiency. You get profit margins that rival oil companies in their prime. Let not mention $5 trillion Nvidia or $4 trillion Microsoft last week – I posted enough about them already.
The higher the ascent, the louder the questions. The dominance of OpenAI, once unassailable, is already eroding as rivals find niches in an expanding field. Fragmentation, not monopoly, may define this new era of intelligence. And while AI reshapes how we work and learn, it still hasn’t earned the public’s full trust. Across much of the world, people believe traditional news more than they believe ChatGPT.
It’s a curious paradox: the technology driving record valuations and record productivity remains something many don’t yet believe in. The data tells the story. Or does it extend the hype?
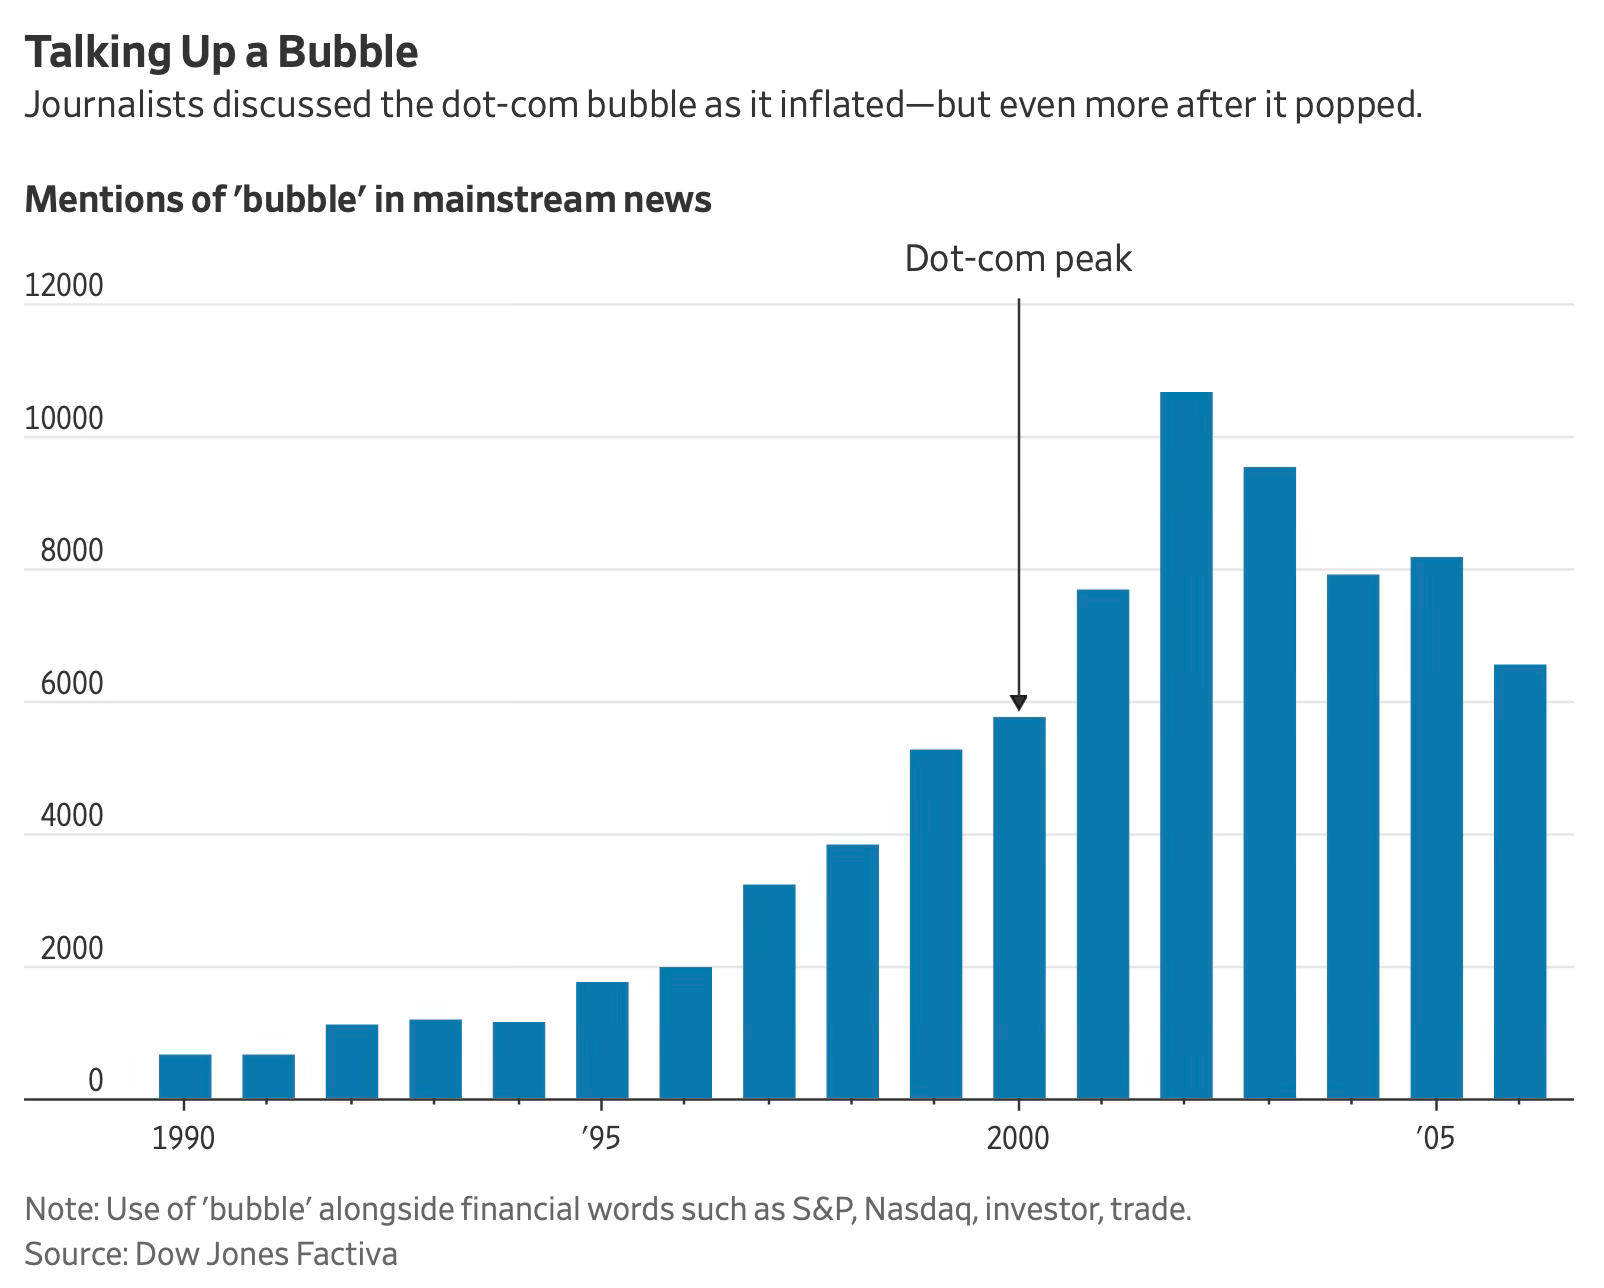
CHART 1 • We only call it a bubble after it bursts
During the dot-com boom, the word “bubble” appeared more often in the media, but mentions exploded only after the crash. This chart shows how financial journalists talked about the bubble as it inflated, but far more once it had already popped.
By the late 1990s, talk of speculation and excess was rising, yet it peaked after 2000 when valuations collapsed. It is a reminder that collective hindsight often comes too late. Markets tend to ignore warnings until the damage is done, and narratives are rewritten only after the fall.
Every generation believes it will spot the bubble before it bursts. History suggests otherwise.
Source: The Wall Street Journal
What fascinates me most is how belief itself fuels progress and risk. Markets rise not only on profits but on faith in a story: that the chips will keep selling, that the AI models will keep improving, that regulation will stay just out of reach. When that faith falters, as it always does (eventually), we call it a correction. But what we’re really seeing is a change in collective imagination.
Every boom begins with genuine innovation, and every bubble ends with lessons written in losses. The line between them is thin and visible only in retrospect. What’s different now is that the machines we’re betting on are also shaping the narrative about themselves. That feedback loop is new, and it may define the next decade of markets, media and truth.
I’ve got four more charts that expand on this story, but they’re for paid subscribers. Consider joining if you want the full edition.
