


For $10 a month, or $100 a year, you support a simple mission: spread great data visualisation wherever it comes from. You help fund the work of finding, sourcing and explaining the charts that deserve a wider audience. And you back a publication built on generosity, transparency and the belief that better understanding makes a better world.
CHART 1 • US workers left behind in share of output
Take a look at this chart from the Financial Times. US companies have seen productivity rise considerably since 1975. Real hourly compensation for employees has also increased, but not at the same pace.
What I really like here is that they have highlighted the IT boom in the mid-90s. As you can see, growth in productivity accelerated during this period and beyond.
What is more concerning is the chart in the lower half, which shows that the share of output that workers receive from that increase in productivity has fallen, especially since the turn of the millennium.
There are lots of reasons why this might have happened. Offshoring may have shifted some of the labour-intensive tasks abroad. Meanwhile, automation and software have replaced some of the tasks that workers used to do. This may have left workers with weaker bargaining power and less leverage to capture the gains in increased productivity that companies have experienced. Of course, specific causes will vary between industries and also between higher- and lower-paid workers.
Perhaps the next productivity boom may come from AI, which may already be reducing the bargaining power of workers further. In the most exposed sectors, we will have to wait and see what happens.
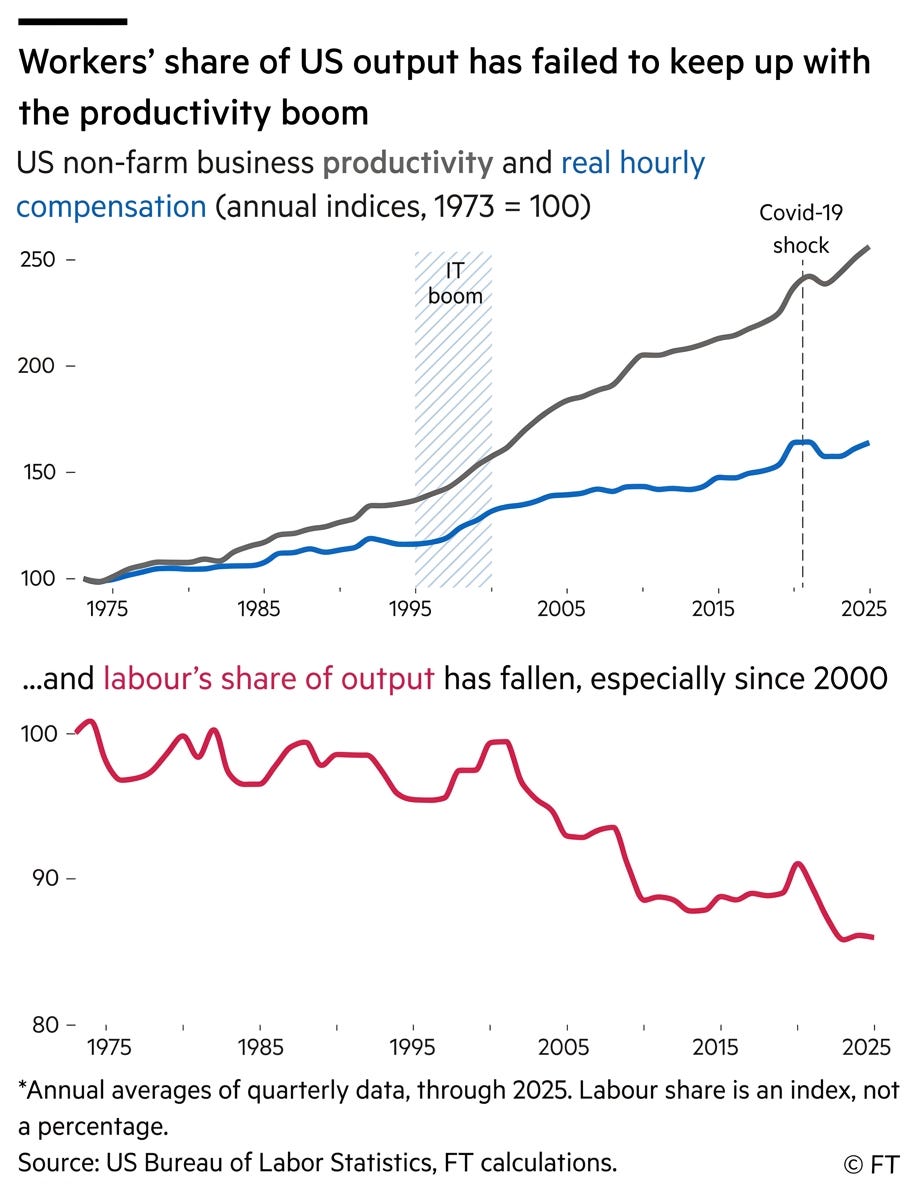
Source: Financial Times
Paid subscribers get access to the other four charts: generational wealth, global city rankings, Asian salary value and economic concentration by land area. Together, they show how age and geography divide access to opportunity.
