


For $10 a month, or $100 a year, you support a simple mission: spread great data visualisation wherever it comes from. You help fund the work of finding, sourcing and explaining the charts that deserve a wider audience. And you back a publication built on generosity, transparency and the belief that better understanding makes a better world.
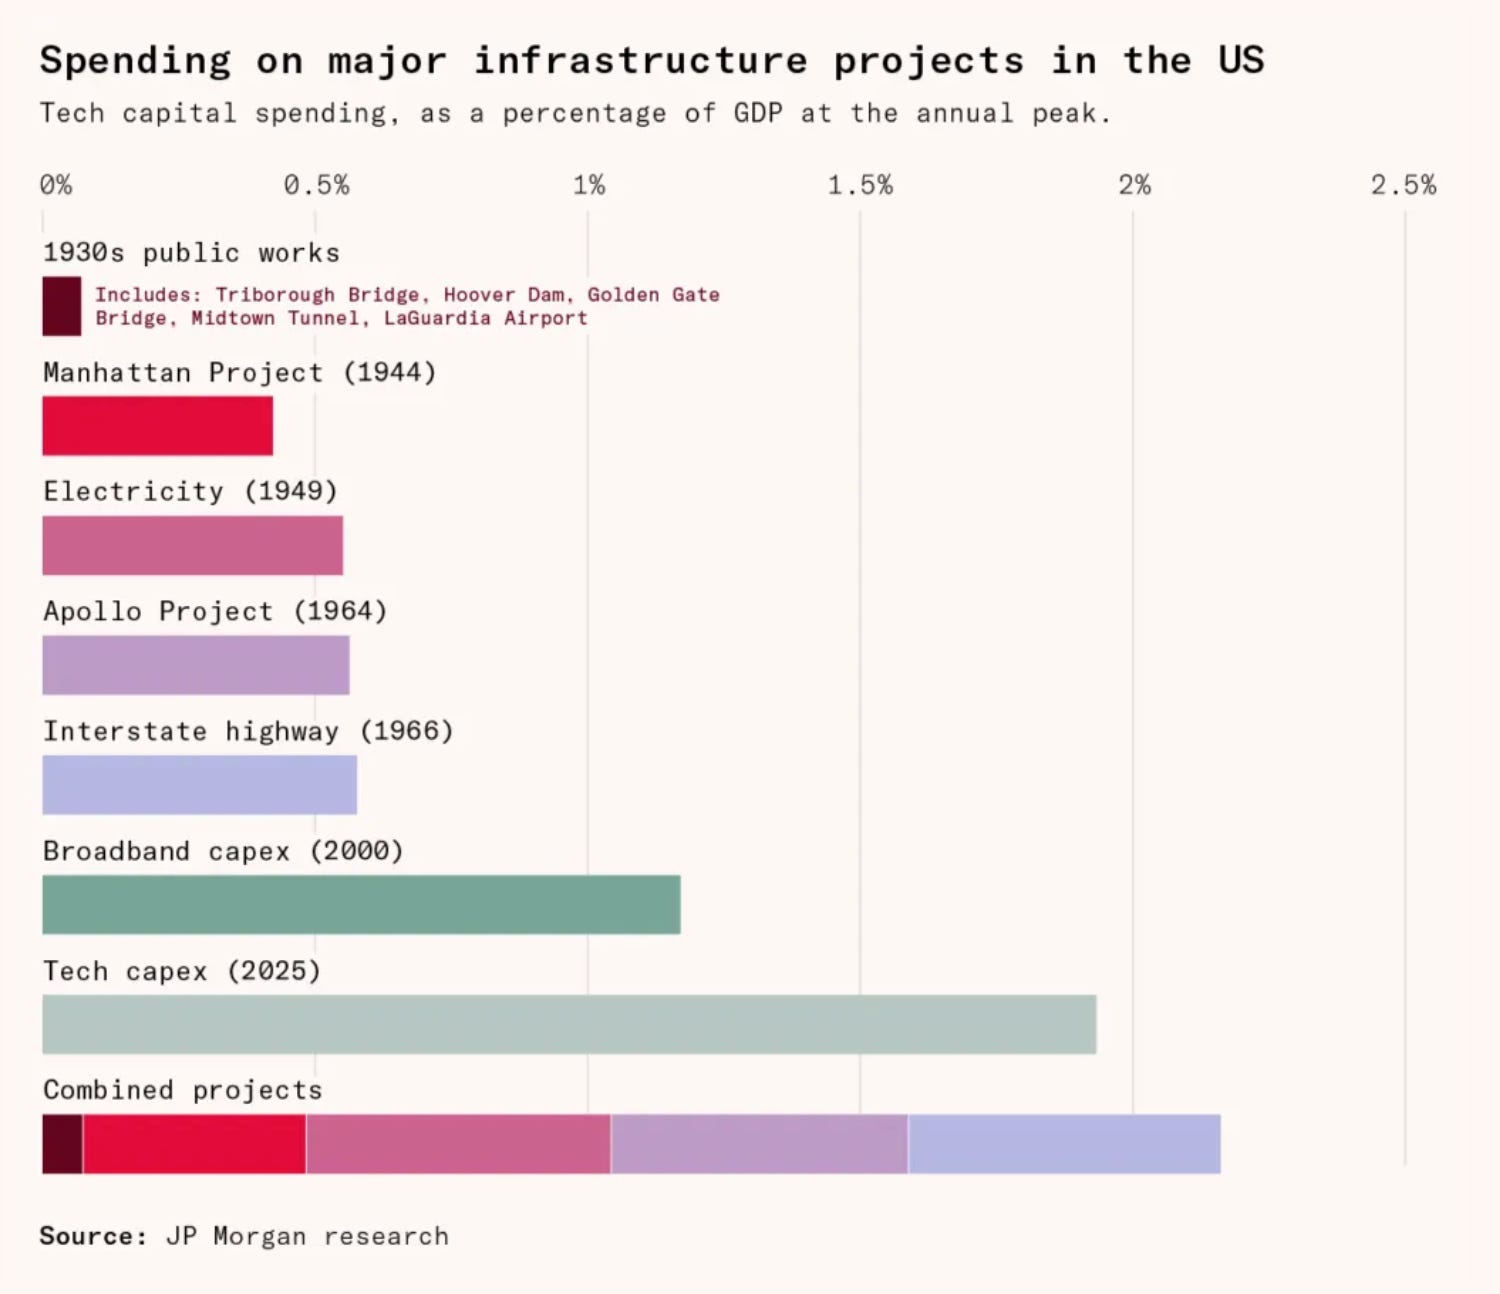
CHART 1 • US tech capex has become a private megaproject
The cost of building AI is now large enough to compare with famous US public works. Data centres need land, power connections, chips, cooling systems and long leases, all financed by a small group of very large companies.
This chart puts 2025 technology capital spending at about 2% of US GDP at the annual peak. On that measure, it is larger than the Manhattan Project, the Apollo moon programme, the interstate highway system or the long build-out of electricity infrastructure, taken one by one.
Those are imperfect comparisons. A data centre is not a moon rocket, and private tech spending is not the same as a public national project. But it is the scale here that is the point. AI is being built like infrastructure before anyone knows how much profitable demand will be there.
Source: The Works in Progress Newsletter
This is why I like the capital-spending chart. It makes AI less abstract. Before AI shows up clearly in productivity statistics, someone has to find land, electricity, chips and enough customers to justify the bill.
Paid subscribers get access to the other four charts: Big Tech AI capex, memory chip valuations, ChatGPT market share and AI model values. Together, they show why AI progress now depends on infrastructure, distribution and model behaviour as much as invention.
