
US tariff revenue hits $30 billion a month
Five charts to start your day

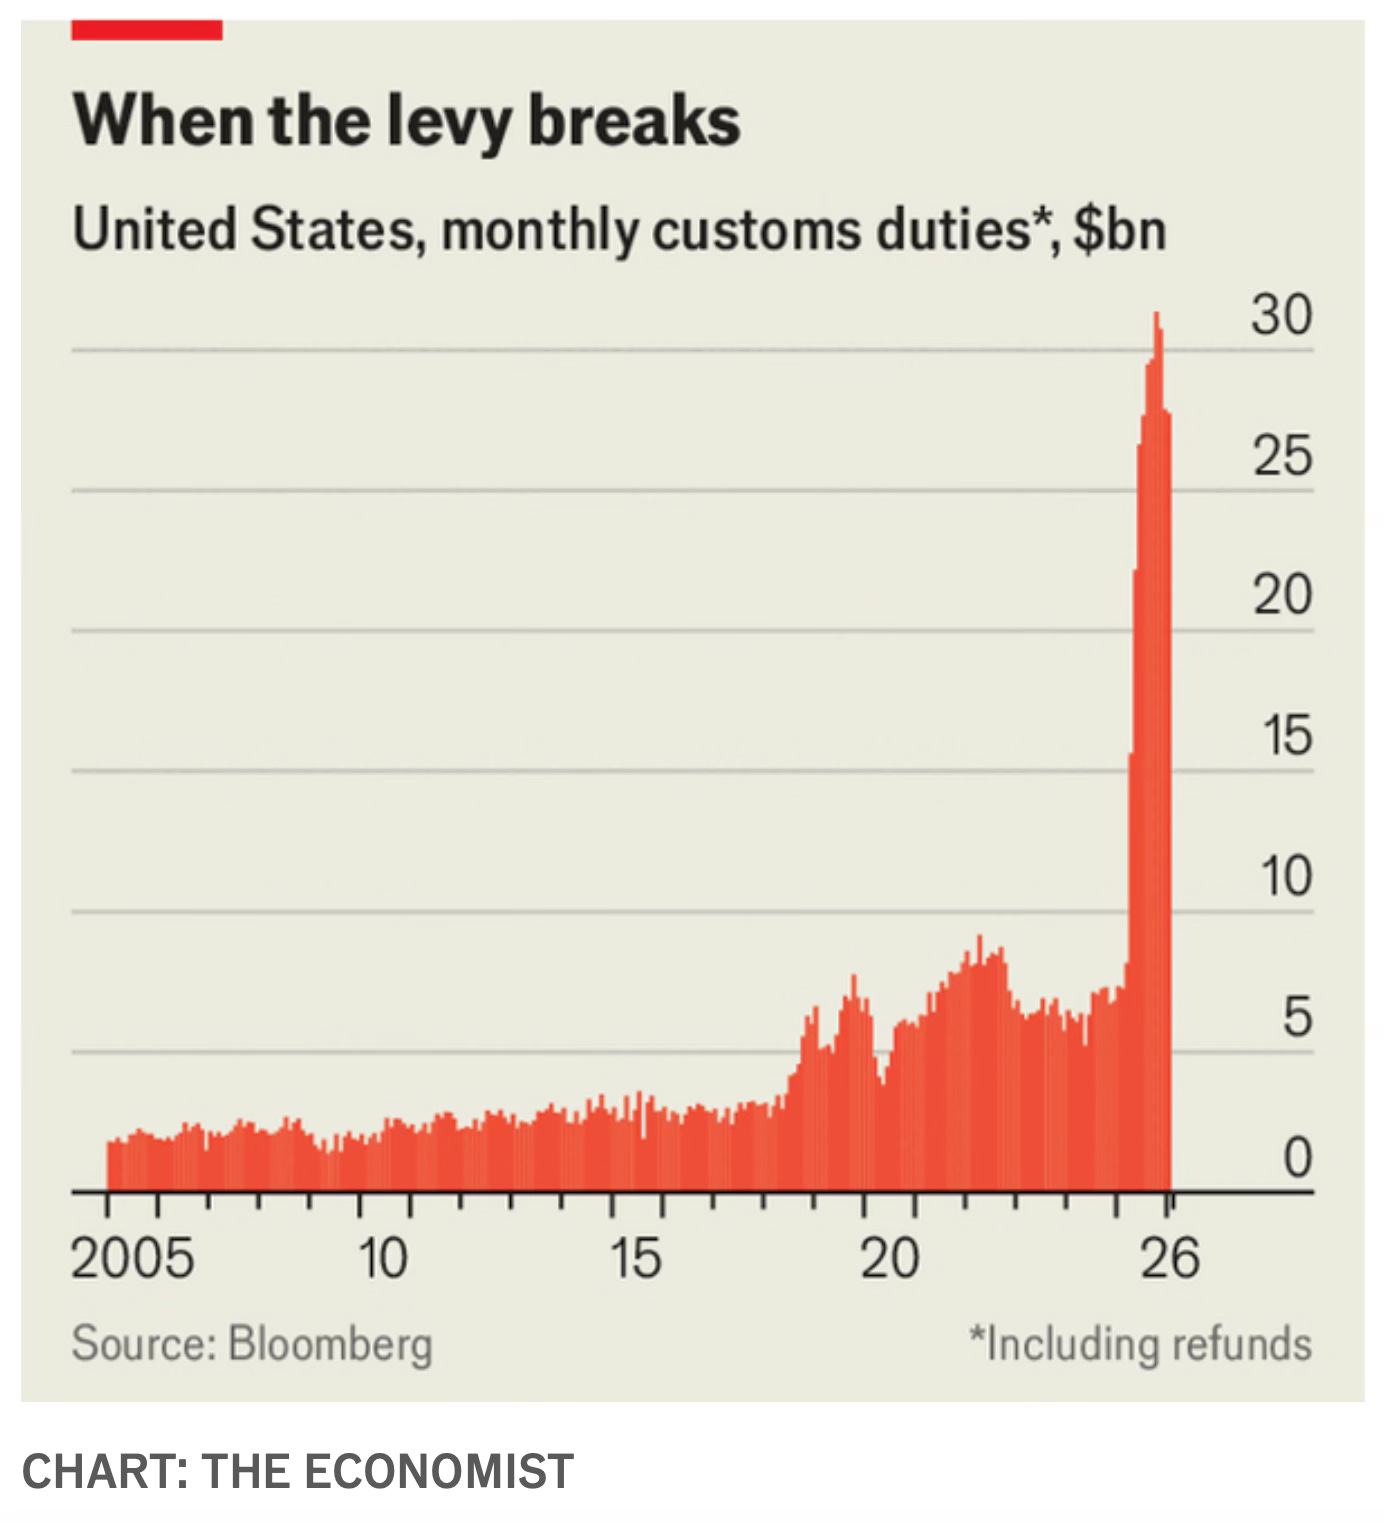
For $10 a month, or $100 a year, you support a simple mission: spread great data visualisation wherever it comes from. You help fund the work of finding, sourcing and explaining the charts that deserve a wider audience. And you back a publication built on generosity, transparency and the belief that better understanding makes a better world.CHART 1 • US tariff revenue hits $30 billion a month
For two decades, US monthly customs duties were a flat, unremarkable line. The first trade war in 2018 pushed collections to between $5 and $8 billion a month. It felt significant at the time.
Trump’s sweeping tariff regime broke this chart. Monthly customs duties spiked to nearly $30 billion, more than the US previously collected in an entire year. It was the most aggressive use of trade policy in a century.
Then the Supreme Court ruled 6-3 that none of it was legal. Chief Justice Roberts was unambiguous: the emergency powers law Trump used to impose the tariffs was never intended for that purpose. Tariffs are taxes, and the Constitution gives that power to Congress, not the president. More than $160 billion had already been collected. The question of refunds remains unresolved and will be fought in the courts for years.
Trump responded within hours with a replacement set of tariffs under a different law, raising global duties to 15%. Legal challenges are already forming. The administration is not retreating. It is searching for a legal vehicle that survives scrutiny.
The chart shows a system pushed to its constitutional limit and struck down. The revenue spike may prove temporary. The battle over who gets to set trade policy in America is just beginning.
Source: Economist
Trade policy can move markets in months. Industrial capacity moves in years. Political cycles move even faster. When those clocks fall out of sync, expectations run ahead of reality.
Economic power is not just about who writes the best software or passes the toughest law. It is about who builds, who supplies, and who controls the bottlenecks when demand surges. The gap between ambition and capacity is where strategy is either vindicated or exposed.
I have four more charts that expand on this story, including what history says about tariff cycles and what investors should watch next. They are in the paid edition. Consider joining if you want the full analysis and the complete set of charts.
