


For $10 a month, or $100 a year, you support a simple mission: spread great data visualisation wherever it comes from. You help fund the work of finding, sourcing and explaining the charts that deserve a wider audience. And you back a publication built on generosity, transparency and the belief that better understanding makes a better world.
CHART 1 • US margin debt has hit a record $1.4 trillion
Margin debt is money investors borrow from brokers to buy more securities. It is not a crash forecast. It tells us how much extra exposure is being carried with borrowed money.
By May 2026, US margin debt was roughly $1.416 trillion, about 54% higher than a year earlier. The signal is that borrowing against portfolios is back at a record level.
Leverage changes the selling process. A fall does not only make investors nervous, but it can force positions to be cut. The risk is not that debt predicts the next crash, but that it can make one move faster.
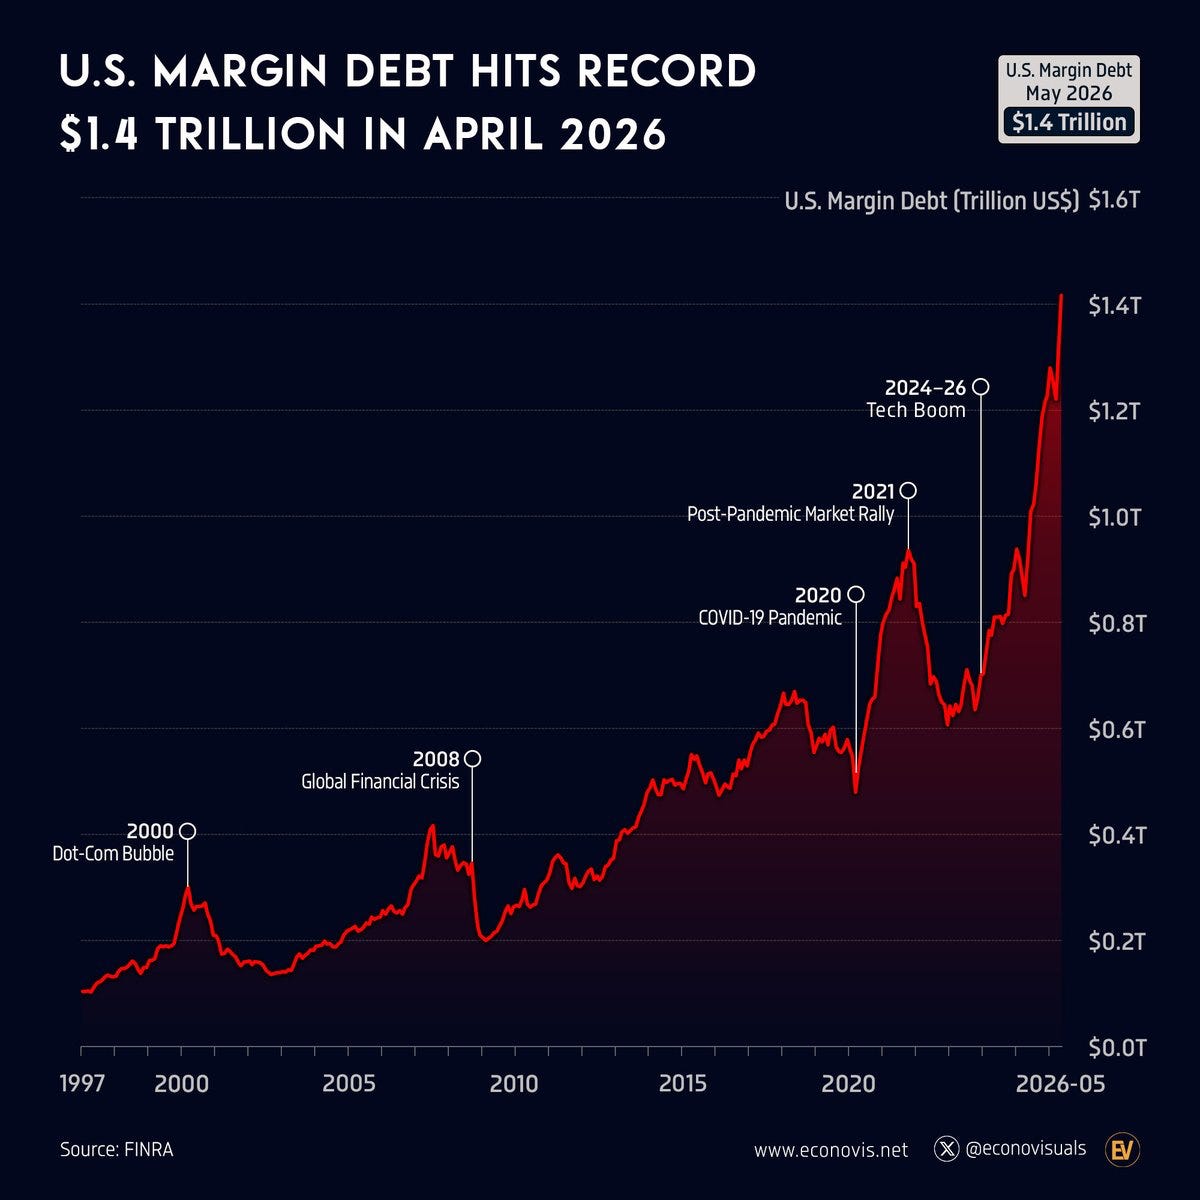
Source: Econovisuals
I don’t read margin debt as a crash alarm. I read it as an indication that market confidence can change faster when more positions are financed with borrowed money. The reason for this are obvious. There is more at stake if you are levered and so the pain felt from a loss is far more painful.
Paid subscribers get access to the other four charts: leveraged ETF assets, expensive AI-heavy chip markets, Google and Nvidia carrying the Magnificent Seven and bonds losing some hedge power. Together, they show how market risk can sit in structures as well as headlines.
