
US deportation on an industrial scale
Five chart to start the day

Having watched Border Force raids from my London flat window, I thought I understood immigration enforcement. The house opposite mine saw regular visits from officers who would cart away cash-paying tenants while the landlady found new ones within days.
It was grimly routine, almost mundane. But what's unfolding in America feels fundamentally different. Where Britain has long treated illegal immigration as a straightforward matter of law enforcement (you're caught, you're deported, end of story), the US has operated in a peculiar grey zone for decades.
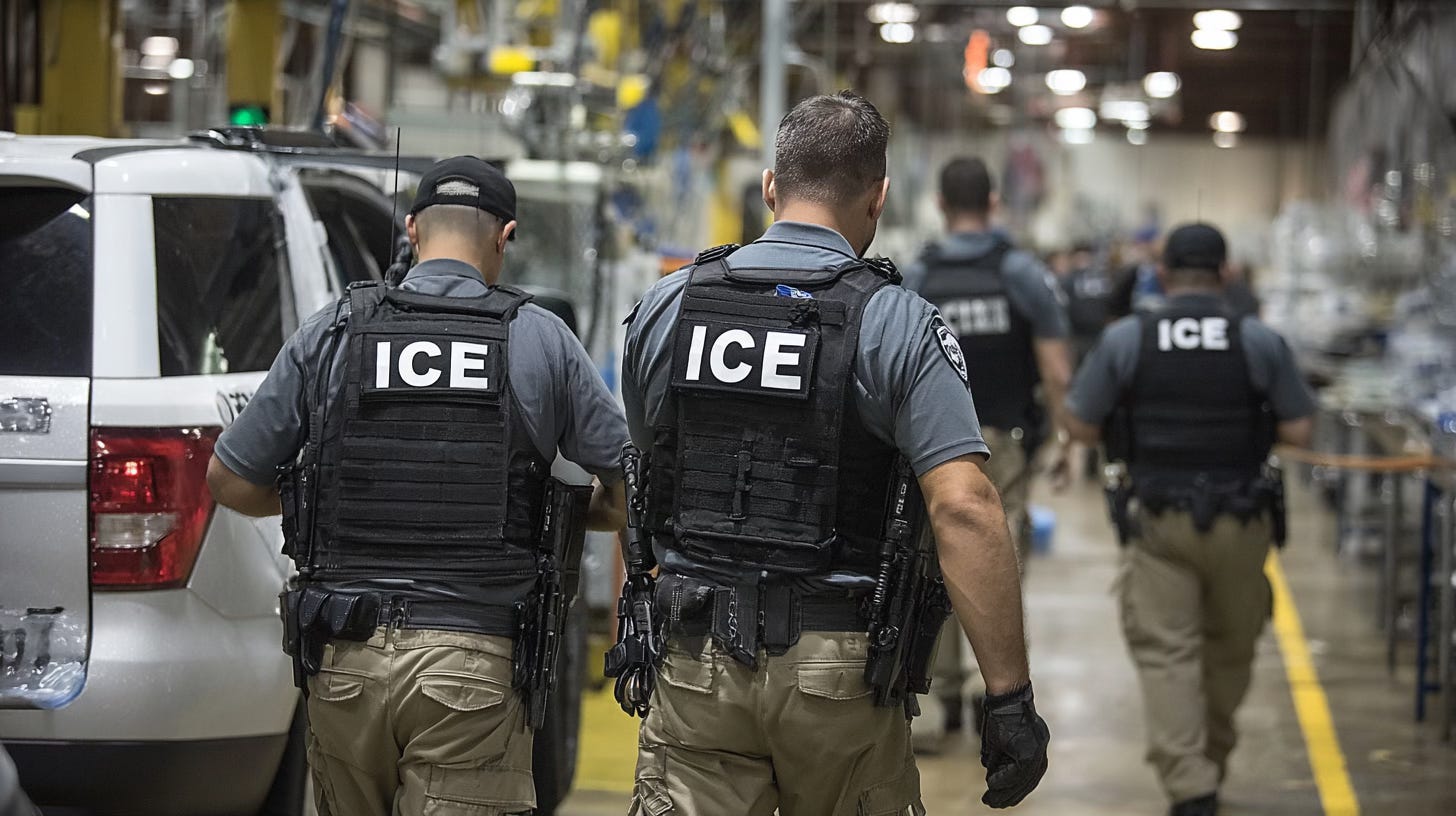
Their "undocumented workers" have held driving licences, paid taxes, sent children to state schools. Now that ambiguity is collapsing into something altogether more dramatic: military aircraft for deportations, industrial-scale detention facilities, and workplace raids that resemble wartime operations more than immigration control. The sheer theatre of it all would be fascinating if the economic implications weren't so profound.
CHART 1 • US deportation is happening on an industrial scale
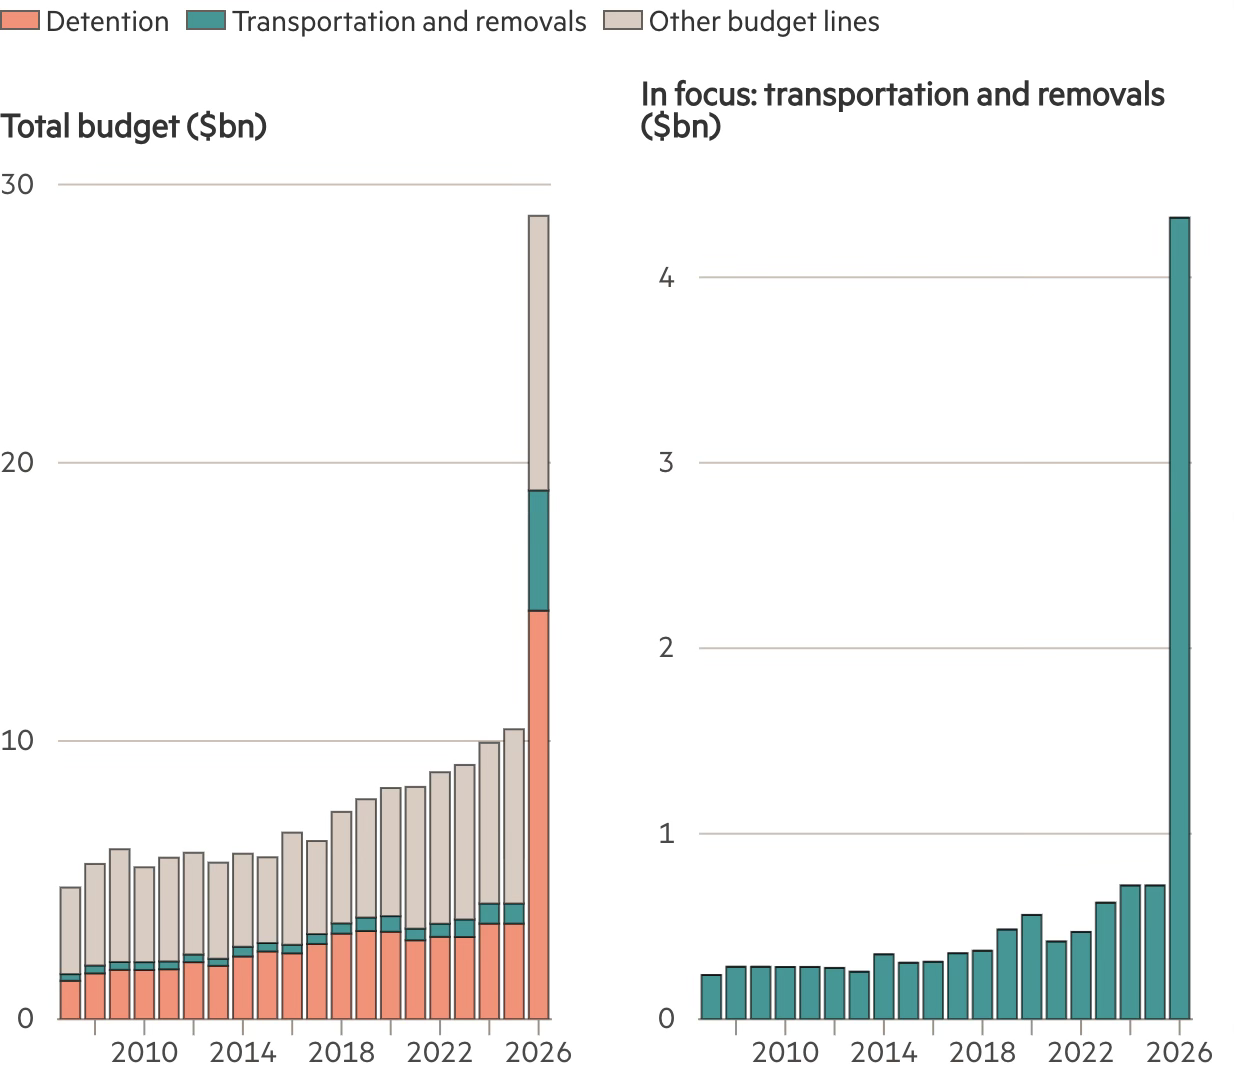
The chart below reveals the sheer scale of what's being built: a deportation infrastructure funded at industrial levels. This isn't a moral judgement, simply an observation of facts. What we're witnessing is a fundamental transformation in how America approaches immigration enforcement. It is a shift so dramatic it rewrites decades of precedent.
The numbers tell a staggering story. Base appropriations for fiscal year 2026 start at $11.3 billion, but the reconciliation bill adds an estimated $18.7 billion for that year alone, pushing total immigration enforcement spending to almost $30 billion (which is what you see in this chart from the Financial Times).
The reconciliation package provides ICE with $75 billion in total to use through to September 2029. To put this in perspective, this funding trajectory would more than double America's detention capacity, expanding from today's 50,000 beds to over 100,000 daily detentions by decade's end.
On a separate note…
Last week, the Hyundai-LG battery plant in Georgia was raided. Federal agents detained 475 workers in what became ICE's largest-ever worksite enforcement action. Construction halted immediately, diplomatic tensions with Seoul erupted, and critical EV supply chain timelines shifted overnight.
The reason this is particularly interesting is that it reveals there's much more to Trump's immigration policy than meets the eye. This isn't simply about deportation. It also achieves certain political objectives.
Consider that Trump has strong views on climate change and actively supports the oil industry. It's difficult not to see this as a politically motivated raid. Why else would you raid a foreign company's battery plant? This appears to be a direct attempt to disrupt America's energy transition infrastructure, which Trump openly dislikes.
Removing workers from already tight labour markets threatens construction and manufacturing output while raising wage pressures. For investors, this means supply chain risk premiums in EV and semiconductor builds, margin compression in construction-dependent sectors, and potential delays to marquee projects requiring global contractors.
Source: Financial Times
I like this chart because it is very powerful. Without even analysing what it means you can see that something has fundamentally changed. It's a great example of why data visualisation can be used as a very powerful communication tool.
Now if you liked this chart, I have four more for you. But, you will need to become a paid subscriber. So please consider it.
