
Unemployment in Germany during the collapse of the Weimar economy
Five charts to start your day


For $10 a month, or $100 a year, you support a simple mission: spread great data visualisation wherever it comes from. You help fund the work of finding, sourcing and explaining the charts that deserve a wider audience. And you back a publication built on generosity, transparency and the belief that better understanding makes a better world.CHART 1 • Unemployment in Germany during the collapse of the Weimar economy
Few statistics capture the social dislocation of the early 1930s as clearly as unemployment. In Germany the labour market deteriorated rapidly as the global economic crisis deepened. By 1932 nearly one third of the workforce was without a job, placing immense strain on the country’s political and social stability.
This chart traces the sharp rise in unemployment after the Wall Street crash and the collapse of international credit. Germany had relied heavily on foreign lending during the late 1920s, particularly from the US. When those financial flows reversed the economy contracted sharply, forcing firms to dismiss workers on a vast scale.
The persistence of mass unemployment eroded confidence in democratic institutions and created fertile ground for political movements promising radical change. The subsequent decline in unemployment after 1933 is often presented as evidence of recovery, though it was closely tied to public works spending and rapid military expansion.
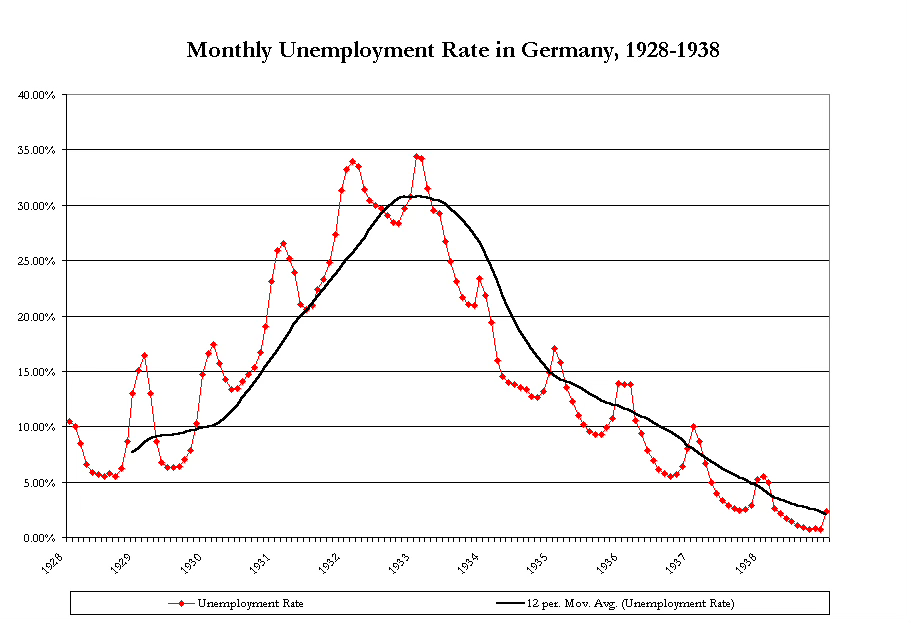
Source: University of Oregon
One of the striking things about economic history is how long structural pressures can build before societies fully recognise them. Demographics shift gradually. Fiscal commitments expand slowly. Energy demand rises step by step as countries grow richer.
I have four more charts that explore these longer term pressures and what they might mean for the global economy in the years ahead. They are part of the paid edition. Consider subscribing if you want the full analysis and the rest of this week’s Five Killer Charts.
