
UK home sales point to a 2026 turn
Five charts to start your day


For $10 a month, or $100 a year, you support a simple mission: spread great data visualisation wherever it comes from. You help fund the work of finding, sourcing and explaining the charts that deserve a wider audience. And you back a publication built on generosity, transparency and the belief that better understanding makes a better world.CHART 1 • UK home sales point to a 2026 turn
Housing markets rarely turn quietly. Expectations shift first, long before transaction data follows.
This chart shows UK estate agents becoming steadily more optimistic about sales over the next twelve months. After a long period of negative sentiment through 2024 and early 2025, expectations move back into positive territory, pointing towards a recovery in 2026.
Short term views remain cautious, but the gap between near term and longer term expectations is the story. It suggests confidence that affordability pressures will ease as mortgage rates stabilise and buyers adjust to a higher rate world.
Housing cycles are driven as much by psychology as by policy. Once agents believe activity will return, listings increase, chains form and liquidity improves. That process often starts before prices move.
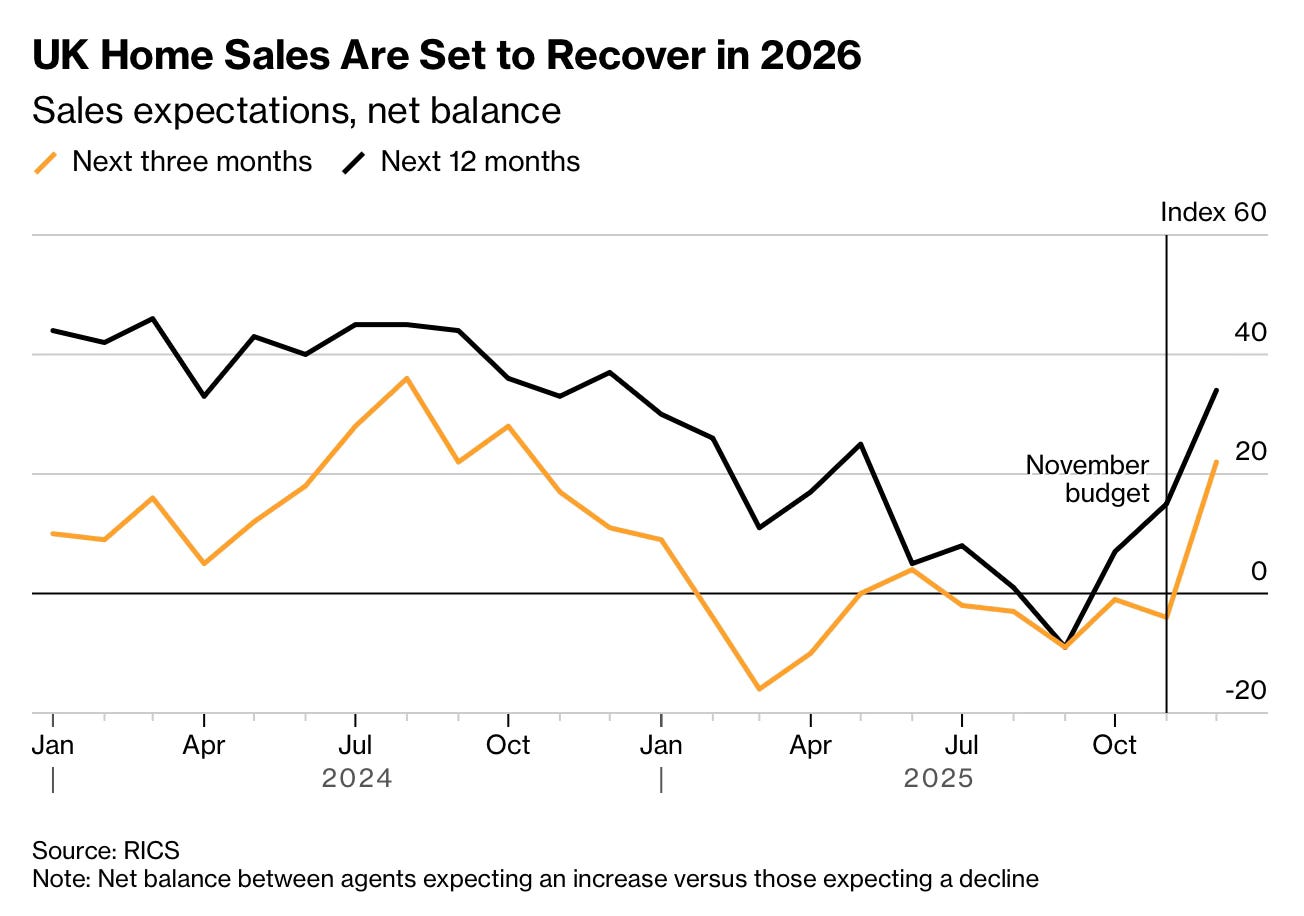
Source: Bloomberg
Where people live determines how they work, how they vote, how they move and how exposed they are to shocks. When housing systems lock people in place, economies lose flexibility long before growth slows.
These charts are not about a single market or cycle. They are about how belief, policy and structure interact over decades. Small changes in confidence or rates can unlock movement. Structural flaws take far longer to fix.
I have four more charts that deepen this story and explore the trade offs policymakers keep avoiding. They are for paid subscribers. Consider joining if you want the full edition and a clearer view of where housing pressure is building next.
