
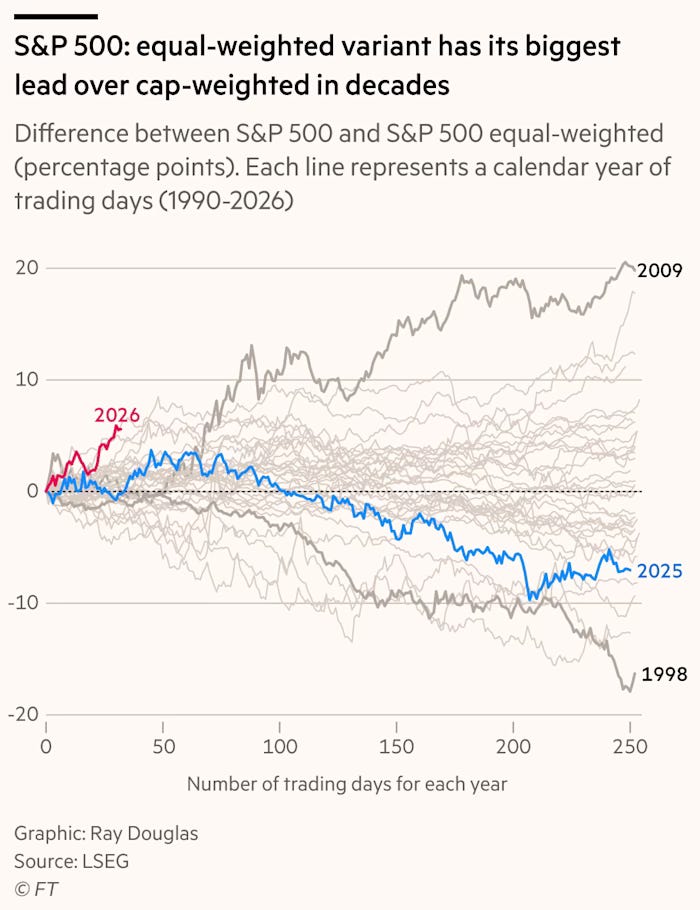
The S&P 500’s equal weight is beating cap weight by the most in decades
Five charts to start your day

For $10 a month, or $100 a year, you support a simple mission: spread great data visualisation wherever it comes from. You help fund the work of finding, sourcing and explaining the charts that deserve a wider audience. And you back a publication built on generosity, transparency and the belief that better understanding makes a better world.CHART 1 • The S&P 500’s equal weight is beating cap weight by the most in decades
For most of the past decade, the S&P 500 was, in practice, a concentrated bet on a handful of mega-cap technology companies. The biggest stocks kept getting bigger, AI investment kept flowing to the same names, and diversification was a drag on returns.
Something broke in 2025.
The equal-weighted S&P 500, which treats Apple and a mid-sized regional bank as equals, outperformed the cap-weighted index by nearly 10 percentage points over the course of the year. That is one of the largest gaps recorded since 1990. The Magnificent Seven, the cloud platforms, the large language model beneficiaries, stopped pulling away from everything else. Capital that had been crowding into the same names began spreading out.
The reason matters. Tariff uncertainty has hit the global supply chains that mega-cap technology companies depend on. A softer dollar and rising geopolitical risk have prompted institutional investors to reduce concentration in US large-cap tech. The AI investment thesis has not collapsed, but the certainty that surrounded it has become more conditional.
The concentration that built up over a decade was unusually extreme. And the forces now working against it: geopolitical fragmentation, tariff risk and valuation gravity. The equal-weight lead is just a precursor to the great rotation we are seeing today, out of tech and into physical value-oriented names.
Source: Financial Times
What strikes me most about this moment is how quickly consensus can dissolve. A year ago, concentration in US mega-cap technology felt almost structural. Today, investors are questioning correlations, reweighting regions and reconsidering what diversification really means.
Markets have a habit of extrapolating the recent past. They build stories around what has worked and assume it will continue. But regimes change quietly at first, then all at once. The discipline is recognising the shift before it becomes obvious.
I have four more charts that dig deeper into this rotation and what it means for portfolios from here. They are in the paid edition. Consider joining if you want the full analysis and the complete set of charts.
