
The market is becoming increasingly concentrated...still
Five charts to start your day

For $10 a month, or $100 a year, you support a simple mission: spread great data visualisation wherever it comes from. You help fund the work of finding, sourcing and explaining the charts that deserve a wider audience. And you back a publication built on generosity, transparency and the belief that better understanding makes a better world.I know this first chart is so 2025. But, it’s actually still a story and we’ve just forgotten that it is. The trend is definitely not your friend in this instance, and not is your memory.
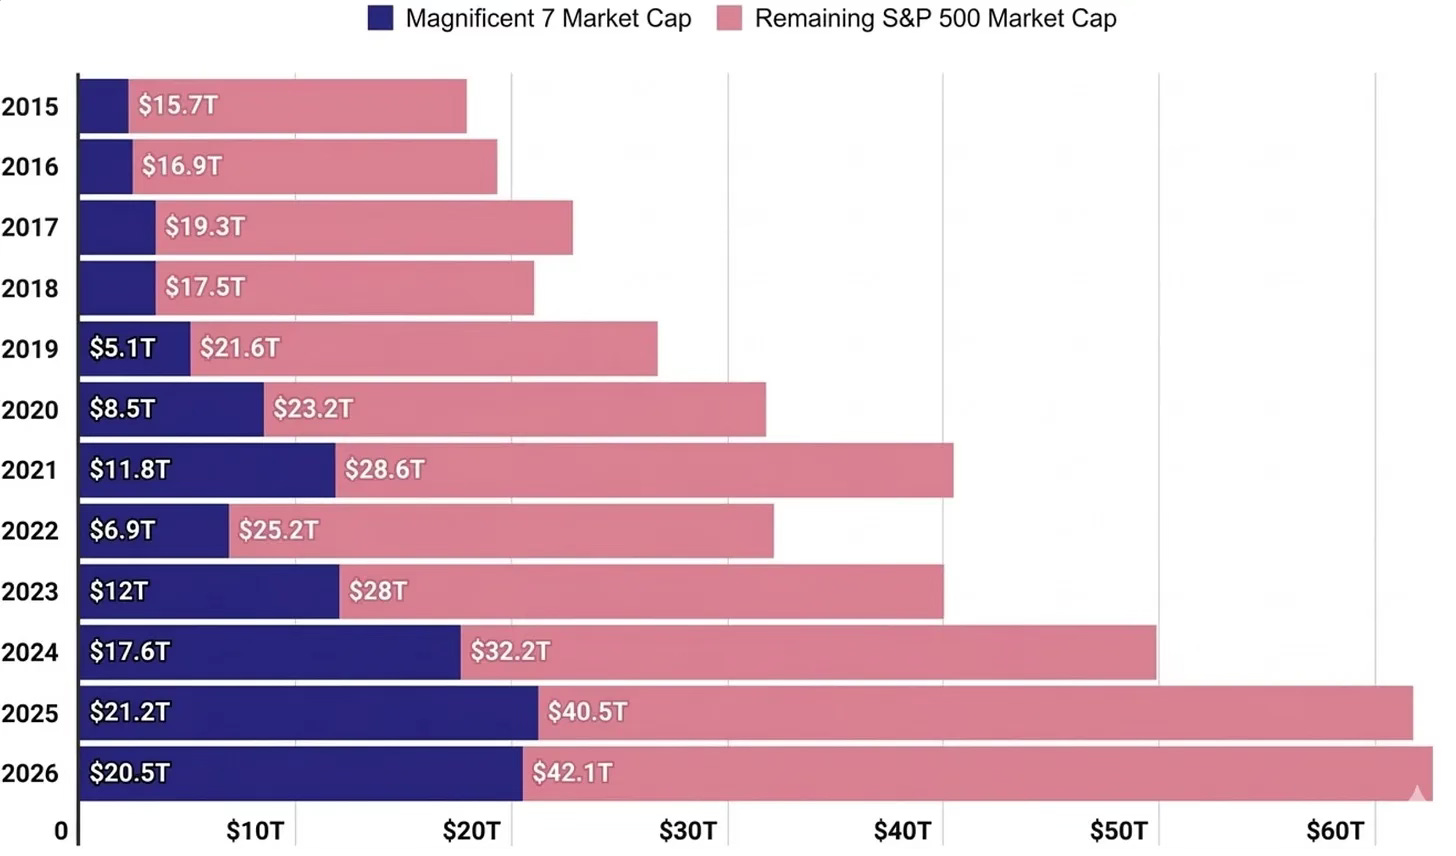
CHART 1 • The market is becoming increasingly concentrated…still
The dominance of the largest technology companies is still a fact, despite mishaps and rotations. The “Magnificent 7” have grown from a relatively modest share of the S&P 500 a decade ago to roughly one third of the index today. What the chart shows is how quickly that concentration has accelerated, and more importantly, persisted.
This is not just a story of rising valuations, but of uneven growth. While the broader index has expanded steadily, the largest gains have been driven by a small group of companies tied to software, cloud, and artificial intelligence. Their combined market value has risen into the tens of trillions, pulling the overall index higher with them.
The consequence is a shift in what the index represents. The S&P 500 still contains hundreds of companies, but its direction is increasingly shaped by a handful. The chart captures that imbalance, where diversification exists on paper, but influence is concentrated in practice.
Source: Compounding Quality
What makes this moment interesting is not just the presence of concentration, but how accepted it has become. Markets rely on a handful of companies. Capital flows towards a single destination. Policy begins to fragment in response. It feels stable, but only because the system is still working.
I’ve got four more charts that expand on this story, but they’re for paid subscribers. Consider joining if you want the full edition.
