


For $10 a month, or $100 a year, you support a simple mission: spread great data visualisation wherever it comes from. You help fund the work of finding, sourcing and explaining the charts that deserve a wider audience. And you back a publication built on generosity, transparency and the belief that better understanding makes a better world.SUBSCRIBE BUTTON
CHART 1 • The Japanese yen has fallen to a 40-year low
Japan’s weak yen is a household, company and government problem. A cheaper currency raises the yen cost of imported energy and food, even while it helps some exporters.
At more than 162 yen per dollar, the currency is near levels last seen in 1986. Traders are watching for possible intervention because Japan’s authorities have to decide whether to spend reserves buying yen or accept more imported inflation.
The awkward part is that every answer has a cost. Higher rates could support the yen but would pressure borrowers and Japan’s bond market; intervention can slow a move but may not change the rate gap with the US. Japan is running out of painless options.
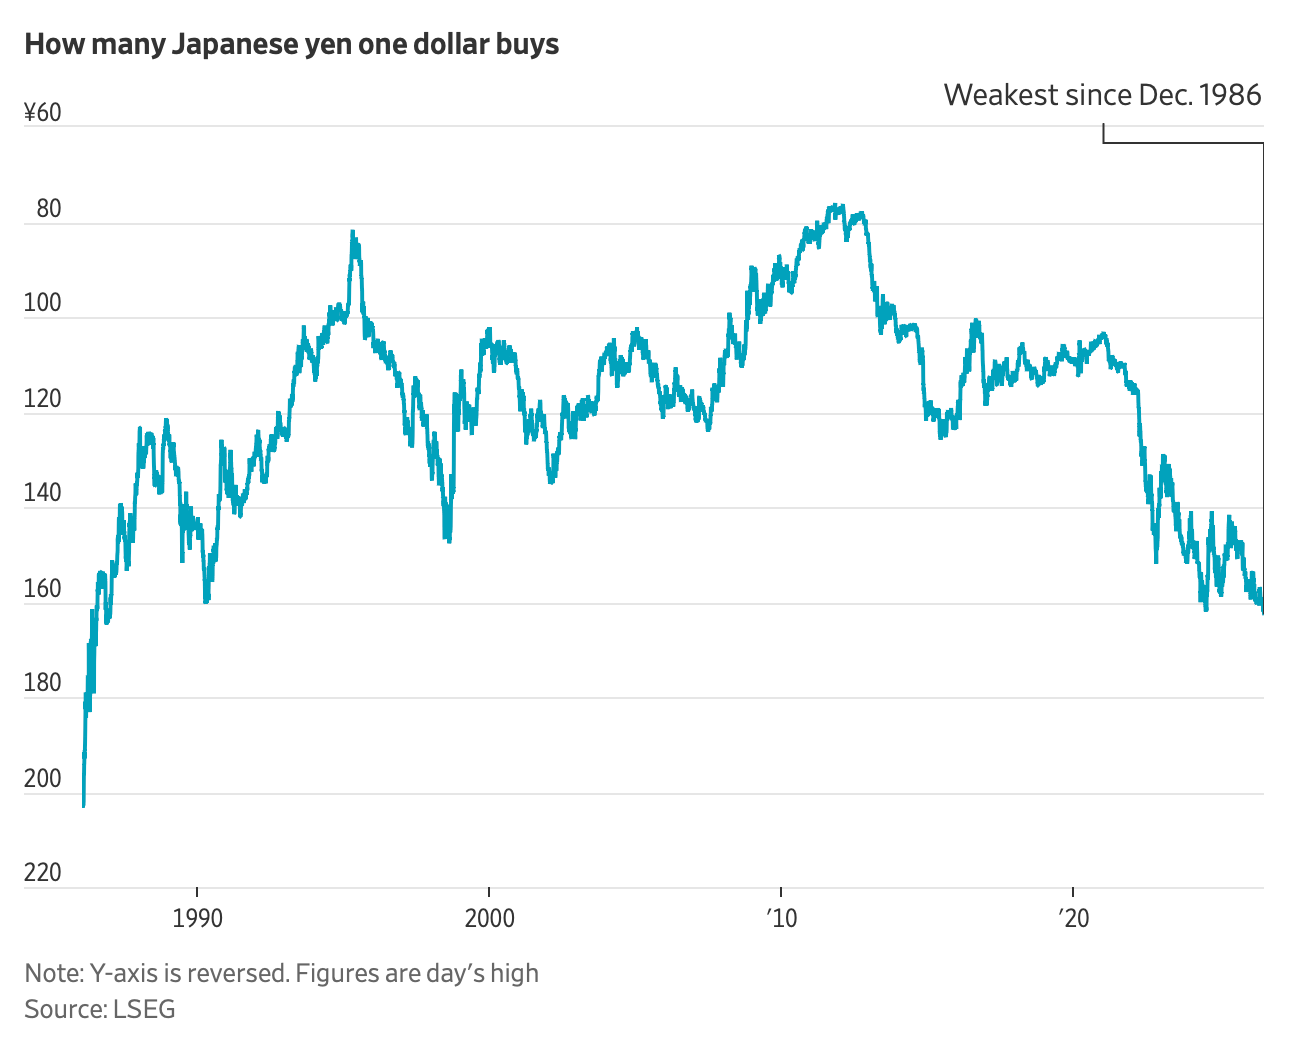
Source: Wall Street Journal
The yen chart is not interesting as a line on a trading screen. It is interesting because a rich country can still be squeezed by a currency it cannot fully control.
Paid subscribers get access to the other four charts: China’s foreign exchange reserves, gold falling despite war, Latin America’s gold production value and crypto long liquidations. Together, they show how money that looks safe can become political, unevenly distributed or painfully timed.
