


For $10 a month, or $100 a year, you support a simple mission: spread great data visualisation wherever it comes from. You help fund the work of finding, sourcing and explaining the charts that deserve a wider audience. And you back a publication built on generosity, transparency and the belief that better understanding makes a better world.
CHART 1 • The EU’s electric car trade has moved into surplus
Europe’s electric-car story is more complicated than a one-way Chinese takeover. Chinese exports are surging, but the EU data still show producers selling more electric cars abroad than they import.
This Financial Times chart puts 12-month running EU electric-car exports above imports through 2026. The recent context makes the split important: China’s monthly car exports passed 1 million in June, increasing the pressure on European manufacturers.
The surplus does not prove Europe is safe. It shows why the policy debate should separate import fear from export performance, because tariffs, subsidies and industrial policy depend on which problem is actually being solved.
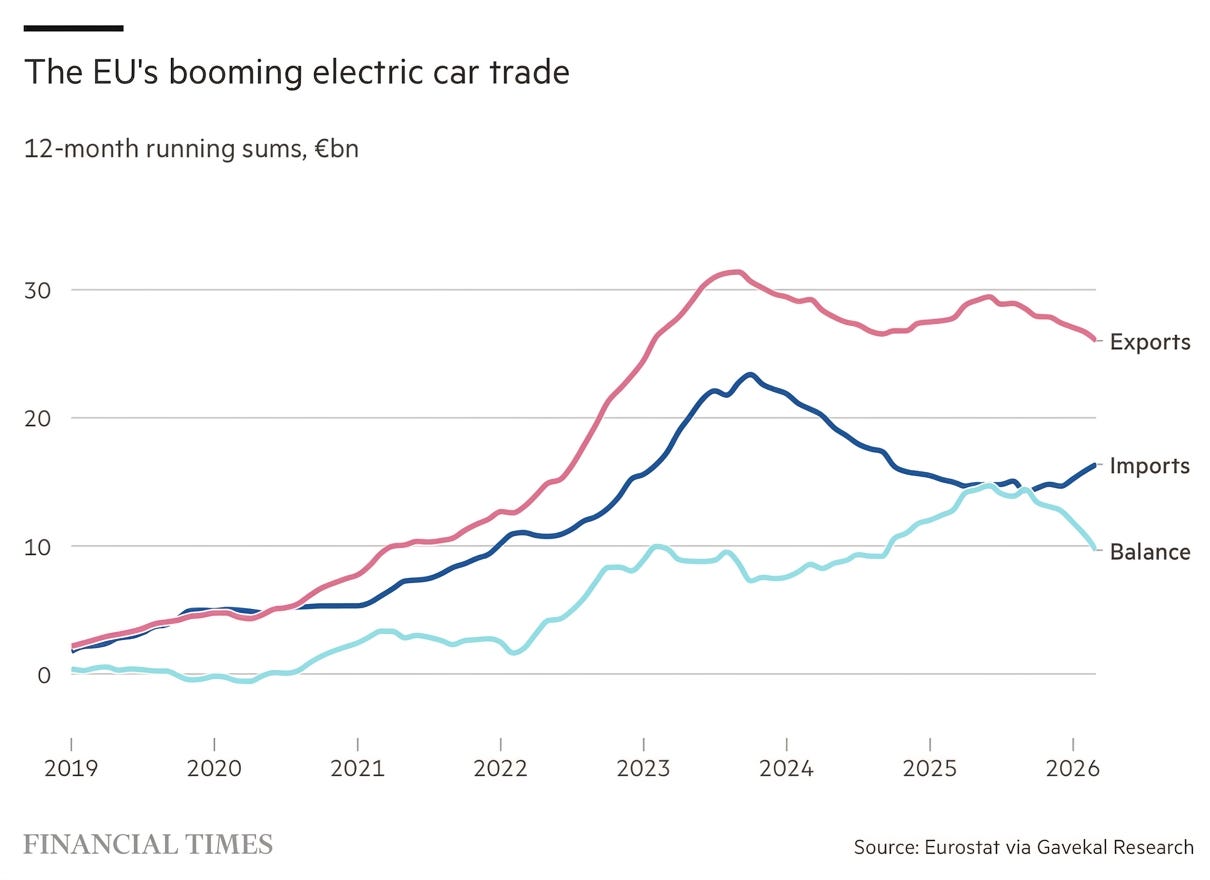
Source: Financial Times
The electric-car surplus is not a comfort blanket. It is a reminder that trade pressure has several channels, and the right policy depends on identifying the channel correctly.
Paid subscribers get access to the other four charts: Chinese imports into the EU, China’s PM2.5 pollution, Japan’s weak yen and Hormuz shipping. Together, they show how pressure can arrive through import substitution, coal and industrial demand, exchange rates and shipping insurance.
