
The AI investment cycle is becoming infrastructure
Five charts to start your day


For $10 a month, or $100 a year, you support a simple mission: spread great data visualisation wherever it comes from. You help fund the work of finding, sourcing and explaining the charts that deserve a wider audience. And you back a publication built on generosity, transparency and the belief that better understanding makes a better world.
Every technology story sounds revolutionary at the start. The interesting part is what happens once the noise fades.
What links these five charts is a quiet shift from excitement to dependency. Artificial intelligence is no longer a speculative idea sitting on the edge of corporate budgets. It is becoming something heavier, slower, and harder to reverse. Infrastructure rather than software. Plumbing rather than promise.
You can see it in where the money is going. Capital spending is rising, margins are concentrating in a few strategic choke points, and adoption is spreading through workplaces without much fanfare. This is how technologies embed themselves into the economy. Not with a bang, but with repetition.
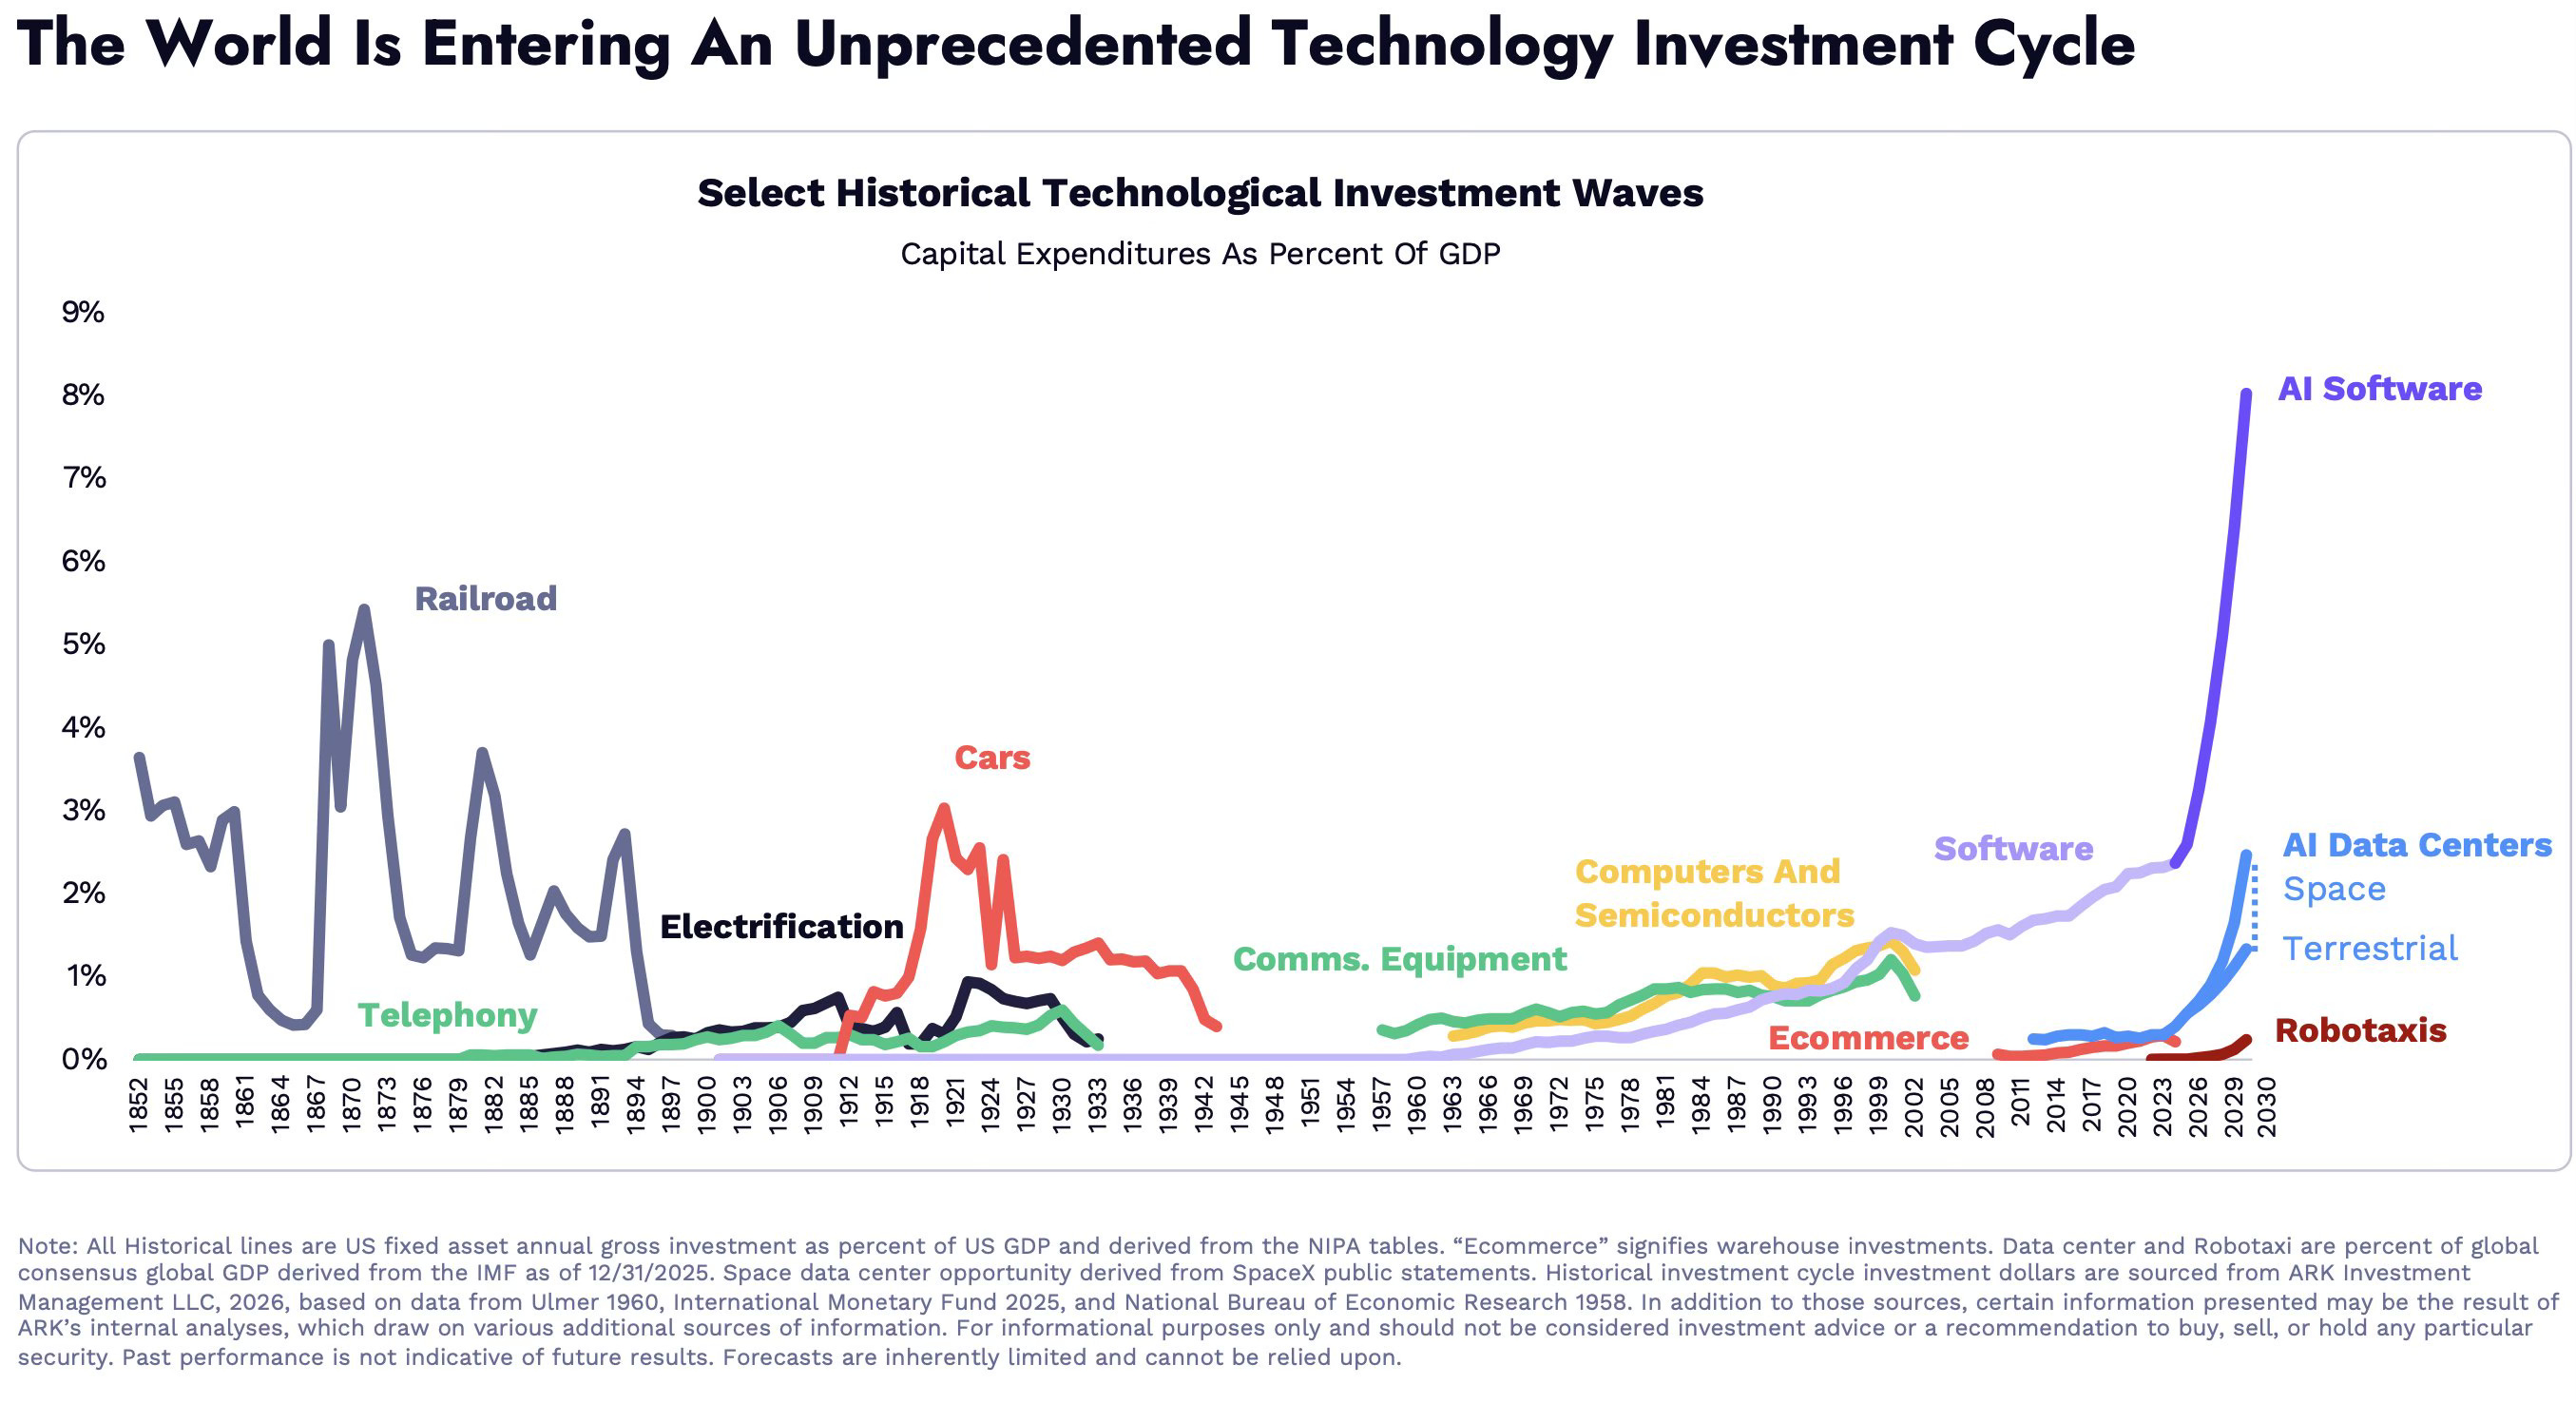
CHART 1 • The AI investment cycle is becoming infrastructure
Every major technology shift begins as a bet and ends as plumbing. This chart places artificial intelligence in that transition phase.
Past investment waves in railroads, electrification, cars, computers and software all followed a similar pattern. Capital spending surged well beyond what seemed reasonable at the time, then settled as the technology became embedded in everyday economic activity. AI appears to be entering the steepest part of that curve.
Unlike earlier digital cycles, AI is capital intensive. It requires vast spending on data centres, semiconductors, power generation, cooling systems and network capacity. That is why capital expenditure tied to AI could rise as a share of GDP rather than remaining confined to software budgets.
This helps explain why technology spending is no longer behaving like a normal cycle. It looks closer to an infrastructure build out.
Source: Ark Invest
When technology becomes infrastructure, it changes how risk works. We tend to overestimate turning points and underestimate what becomes normal.
I’ve got four more charts that expand on this story and explore what infrastructure driven technology means for markets, labour, and capital allocation. They are for paid subscribers. Consider joining if you want the full edition.
