


For $10 a month, or $100 a year, you support a simple mission: spread great data visualisation wherever it comes from. You help fund the work of finding, sourcing and explaining the charts that deserve a wider audience. And you back a publication built on generosity, transparency and the belief that better understanding makes a better world.
CHART 1 • Technology now makes up more than 50% of the S&P 500
The first data visualisation that I ever made was based exactly on this subject, at least the first data visualisation that went viral. I remember it clearly. It was December 2020. We were in the midst of Covid and I published an animated donut chart showing just this story.
Of course, it isn’t clear-cut because there is no actual technology sector in the S&P 500. It’s an amalgamation of different stocks that are technically considered technology companies. The reason is that technology companies can exist across a wide number of sectors.
At the time, tech stocks actually accounted for nearly 40% of the S&P 500. Now that’s risen to 50%. It’s not really that surprising though.
That was the takeaway of that data visualisation and it should be the takeaway of this one too. We are now in a technological economy and so in the future every stock could in theory become a technology stock in the S&P 500 and yet still be part of their respective GIC sectors.
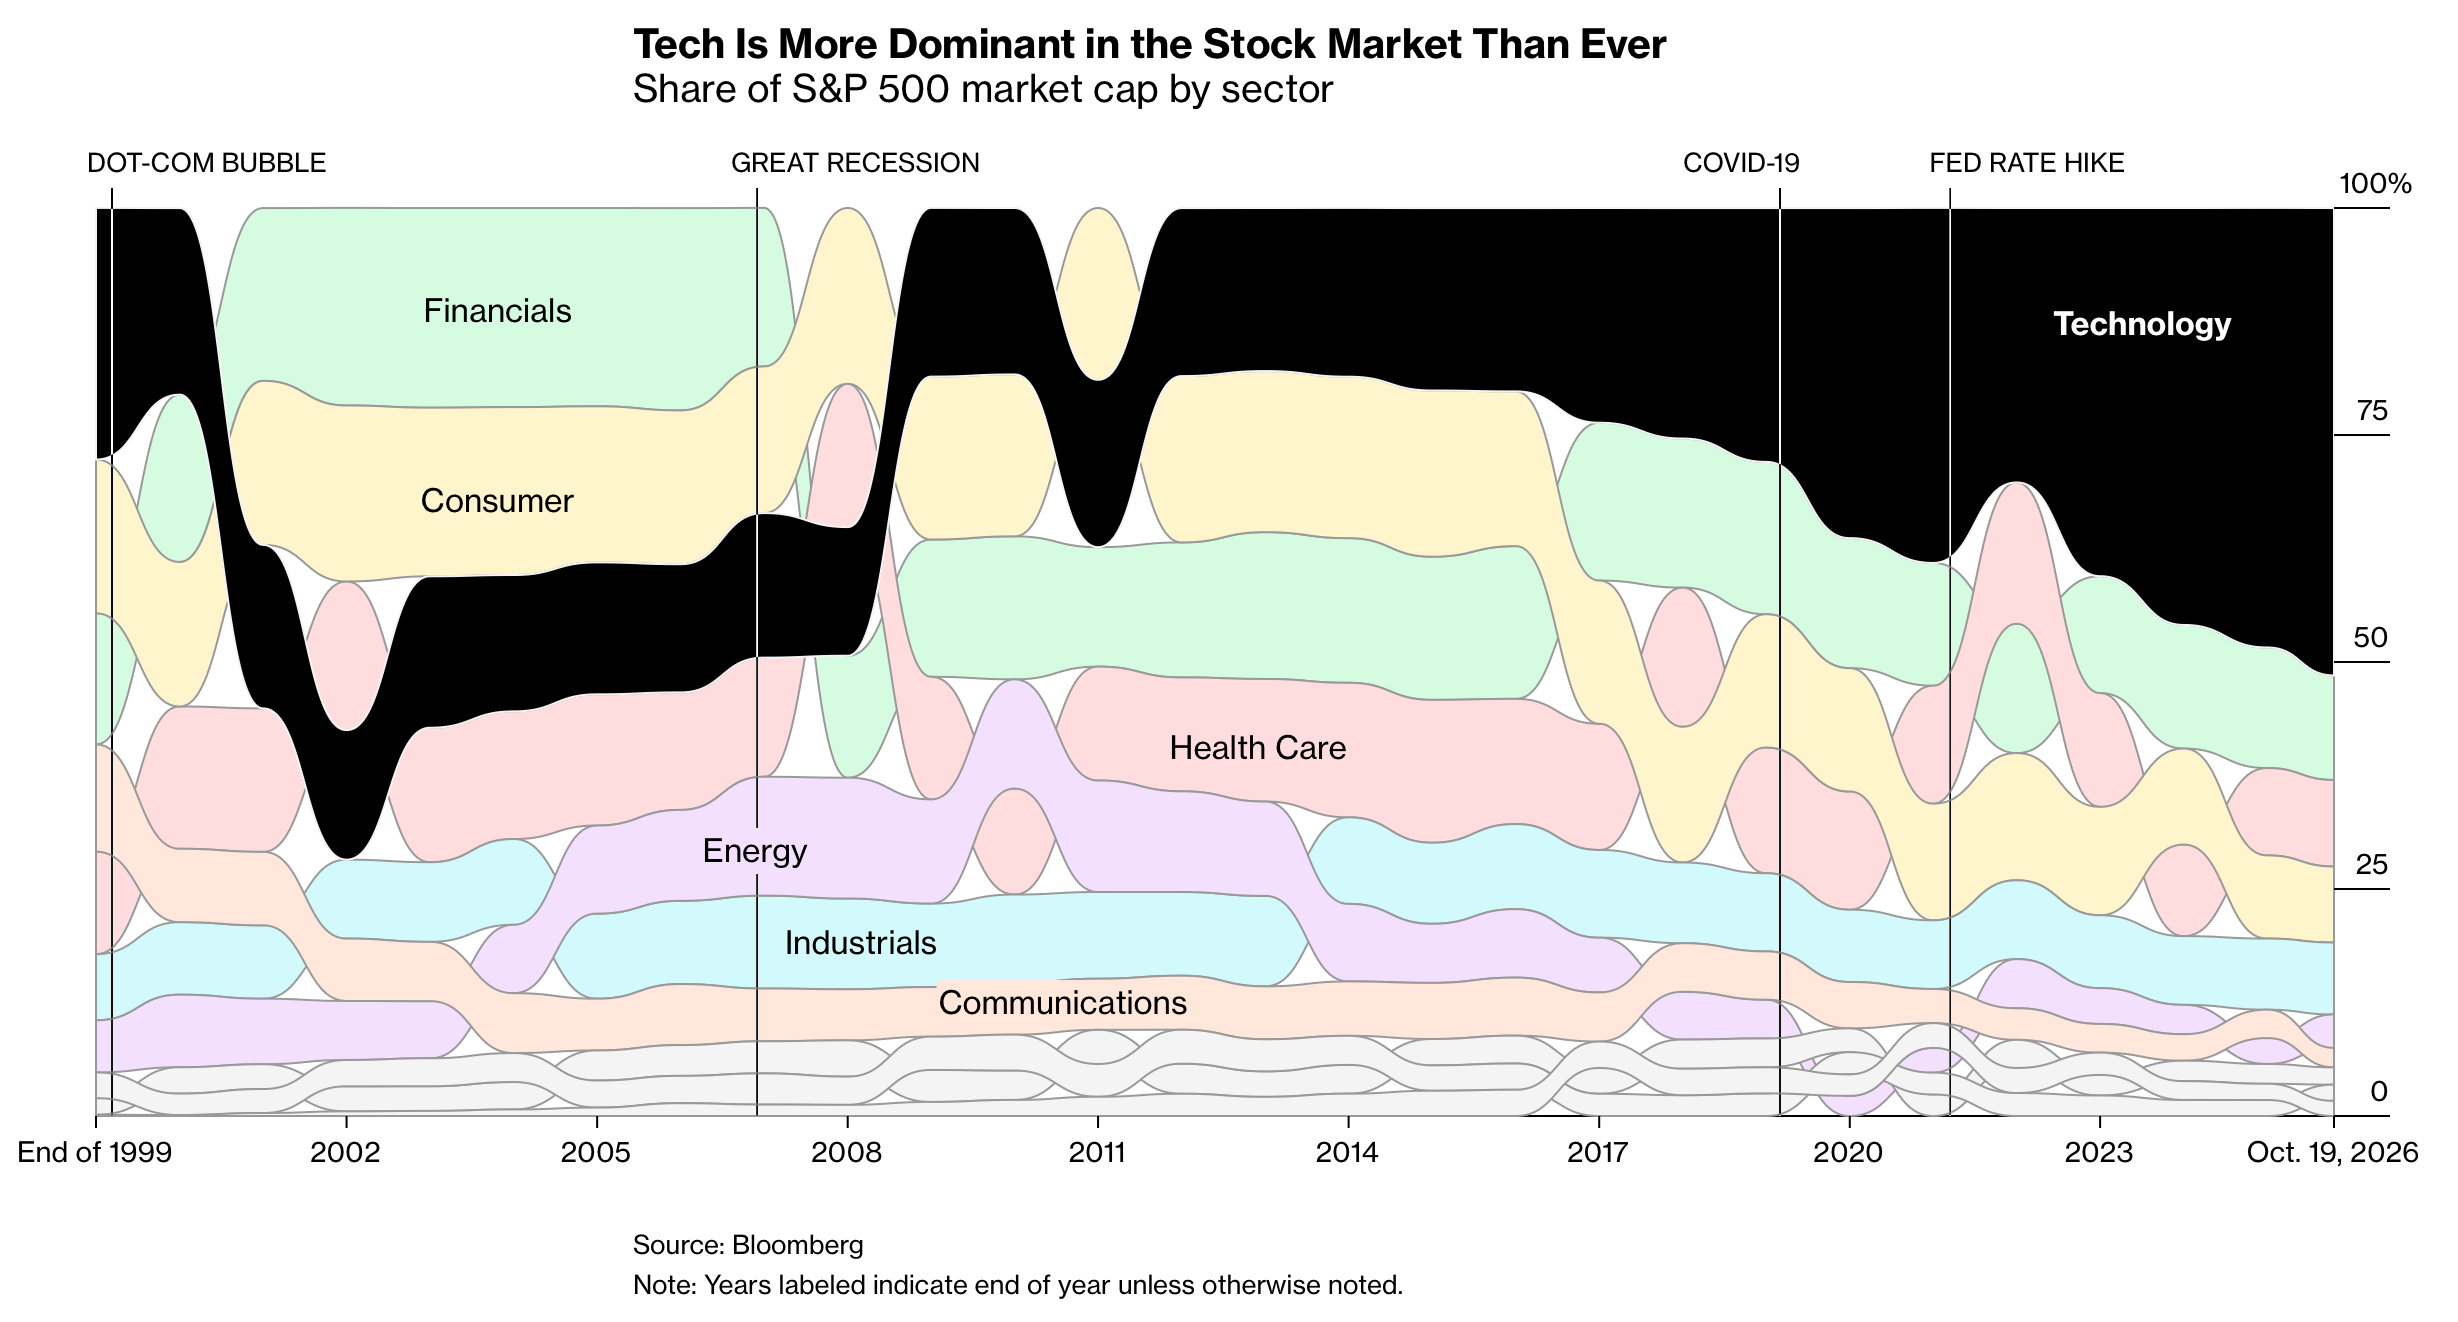
Source: Bloomberg
Paid subscribers get access to the other four charts: active bond funds, private-equity returns, Apple’s services profit and US productivity. Together, they show why the composition and measurement of growth matter as much as the headline rate.
