
Tech earnings have outstripped the rest of the world
Five charts to start your day


For $10 a month, or $100 a year, you support a simple mission: spread great data visualisation wherever it comes from. You help fund the work of finding, sourcing and explaining the charts that deserve a wider audience. And you back a publication built on generosity, transparency and the belief that better understanding makes a better world.CHART 1 • Tech earnings have outstripped the rest of the world
This chart shows just how dramatically the global profit landscape has changed. For most of the past three decades technology earnings moved in line with the rest of the market. That era is over. Since around 2015 tech has broken away and the gap has widened with every cycle.
World technology earnings are now up nearly sixfold from their 2009 baseline. Earnings for the rest of the global market have barely doubled. The divergence really accelerates after 2020 as cloud computing digital advertising semiconductors and now AI became the strongest profit machines in the world economy. Tech firms have benefited from network effects global scaling and structurally higher margins which means every wave of innovation compounds more quickly than the one before. The plateau in non tech earnings highlights how much slower traditional sectors grow by comparison.
This gap is not simply about hype. It reflects a long structural shift where value creation has moved from physical industries to digital ones and now into AI driven automation. The chart makes clear that global earnings leadership is no longer broad based. It is concentrated in technology.
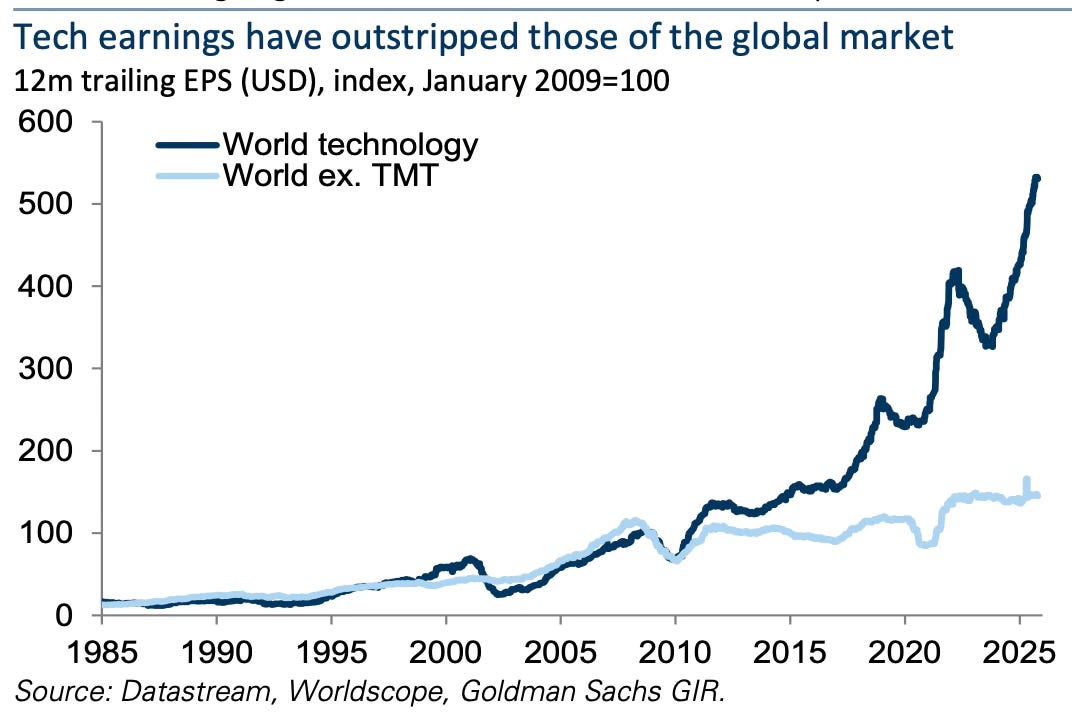
Source: Goldman Sachs
What stands out in all of this is the imbalance. Earnings growth has never been more concentrated. Investment has never been more focused on the physical backbone of computing. Public anxiety has rarely been higher. It is a reminder that progress does not move evenly. It collects in pockets and leaves questions in its wake.
I have four more charts that expand on these patterns and dig into what they mean for the next phase of the AI cycle. They are for paid subscribers. If you want the full edition and want to support the work behind this newsletter, consider joining.
