
Software growth was already slowing before the AI threat arrived
Five charts to start your day


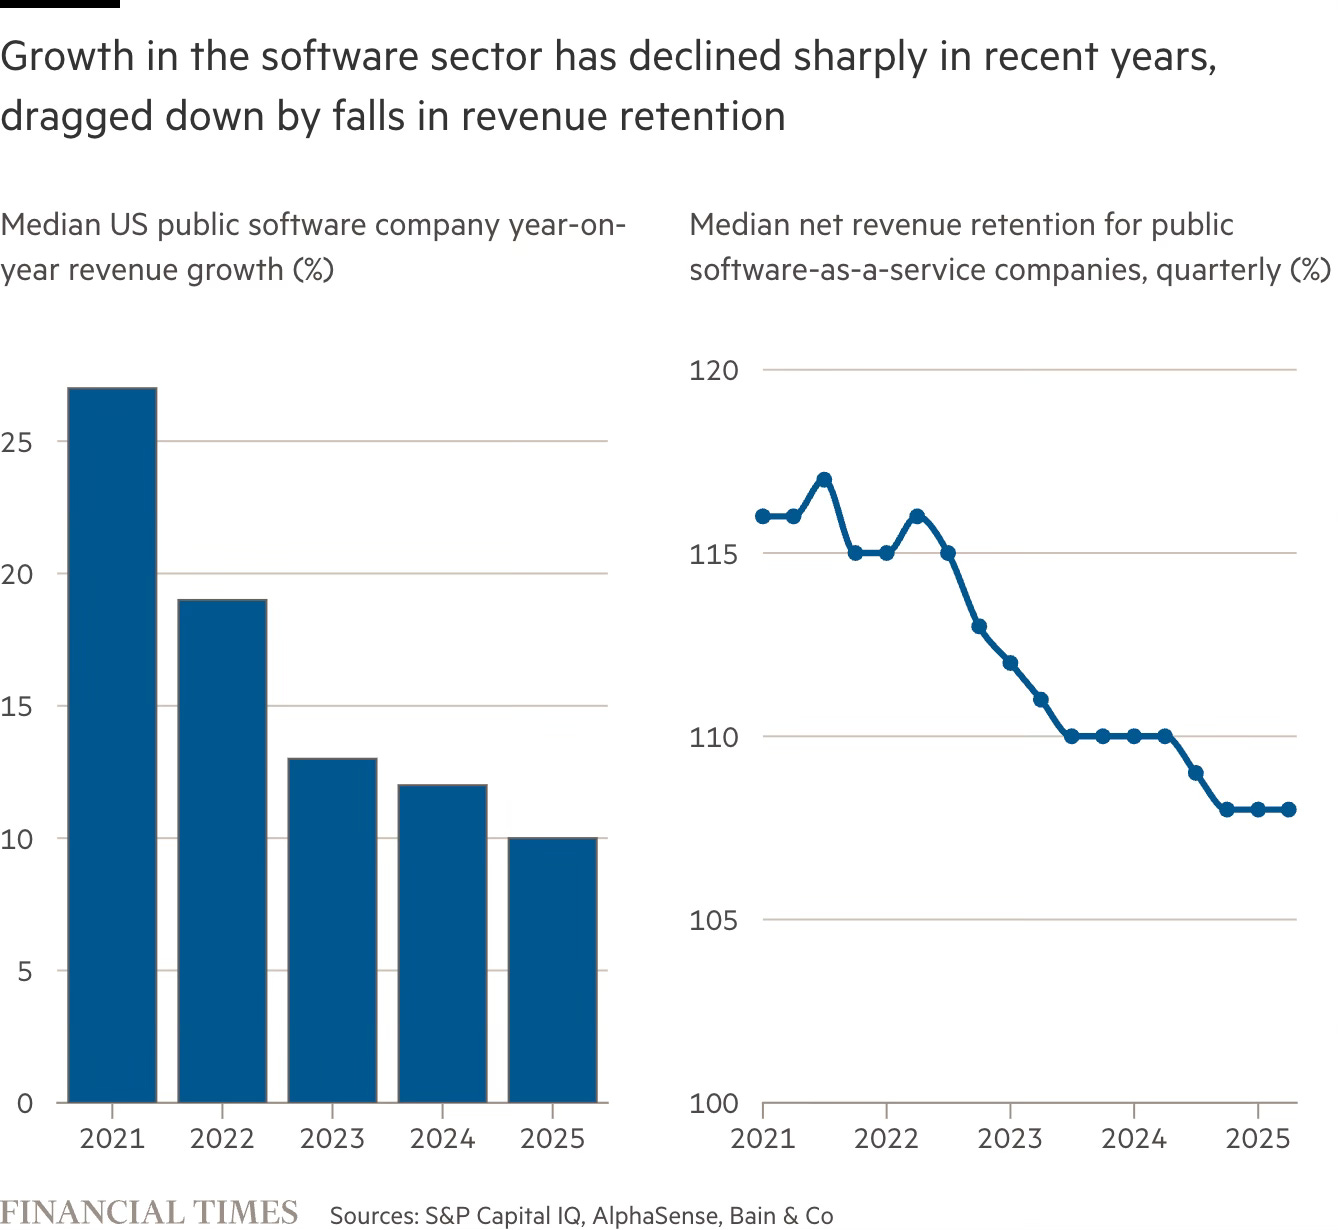
For $10 a month, or $100 a year, you support a simple mission: spread great data visualisation wherever it comes from. You help fund the work of finding, sourcing and explaining the charts that deserve a wider audience. And you back a publication built on generosity, transparency and the belief that better understanding makes a better world.CHART 1 • Software growth was already slowing before the AI threat arrived
The numbers were deteriorating before the scare began. Median revenue growth for US public software companies has fallen from roughly 27% in 2021 to around 10% in 2025. Uncomfortable on its own. But net revenue retention has been sliding alongside it, from around 116% at the peak to roughly 108% today.
In subscription economics, that shift matters. When retention sits comfortably above 115%, existing customers fund growth through expansion. At 108%, that engine is running lean. Companies rely more heavily on new customer acquisition. Margins tighten. Valuations become harder to justify.
Now layer in the current anxiety.
In 2026, investors have begun rotating out of software into non-tech equities, dividend payers and consumer staples. The concern is not simply slower growth. It is the possibility that AI tools, rapid application development and vibe-coded alternatives compress pricing power. If basic workflow software can be replicated cheaply, the premium SaaS model faces a structural question it has not had to answer before.
The chart does not prove that AI is already eroding margins. But it shows that the cushion is thinner than it looks. Retention is lower. Growth is slower. In that environment, even a modest threat to pricing power can feel existential.
Source: Financial Times
The story was supposed to be simple. AI would turbocharge growth, defend margins and extend the dominance of the software model. Instead, the foundations were already softening before the disruption narrative reached fever pitch.
I have four more charts that expand on where this repricing could lead and which parts of the market look most exposed. They are for paid subscribers. Consider joining if you want the full edition and a clearer view of how this AI cycle may unfold.
