

For $10 a month, or $100 a year, you support a simple mission: spread great data visualisation wherever it comes from. You help fund the work of finding, sourcing and explaining the charts that deserve a wider audience. And you back a publication built on generosity, transparency and the belief that better understanding makes a better world.
CHART 1 • Russian attacks on Ukrainian grain triple
Russia’s war in Ukraine is straining food and fuel supplies. And this doesn’t just affect Ukraine; it also affects Russia, as Russian farmers are now struggling to export their own crops. This includes grain exports through the Black Sea, which usually account for 80% of the country’s exports.
For Ukrainian farmers, their normal sea routes have become too dangerous to use due to deliberate and targeted attacks by Russia. In fairness, both countries are assaulting each other’s exports of grain and have done so over the past year, as you can see in this chart. But it’s asymmetric. Russia has always proactively targeted Ukraine’s grain exports, and the attacks you see here from Ukraine are far more moderate counterattacks.
What’s frightening is the global impact, because both Russia and Ukraine export a huge amount of grain to the global market, especially to emerging markets. This will have an impact not just on food inflation, but also on countries where grain supply is running low.
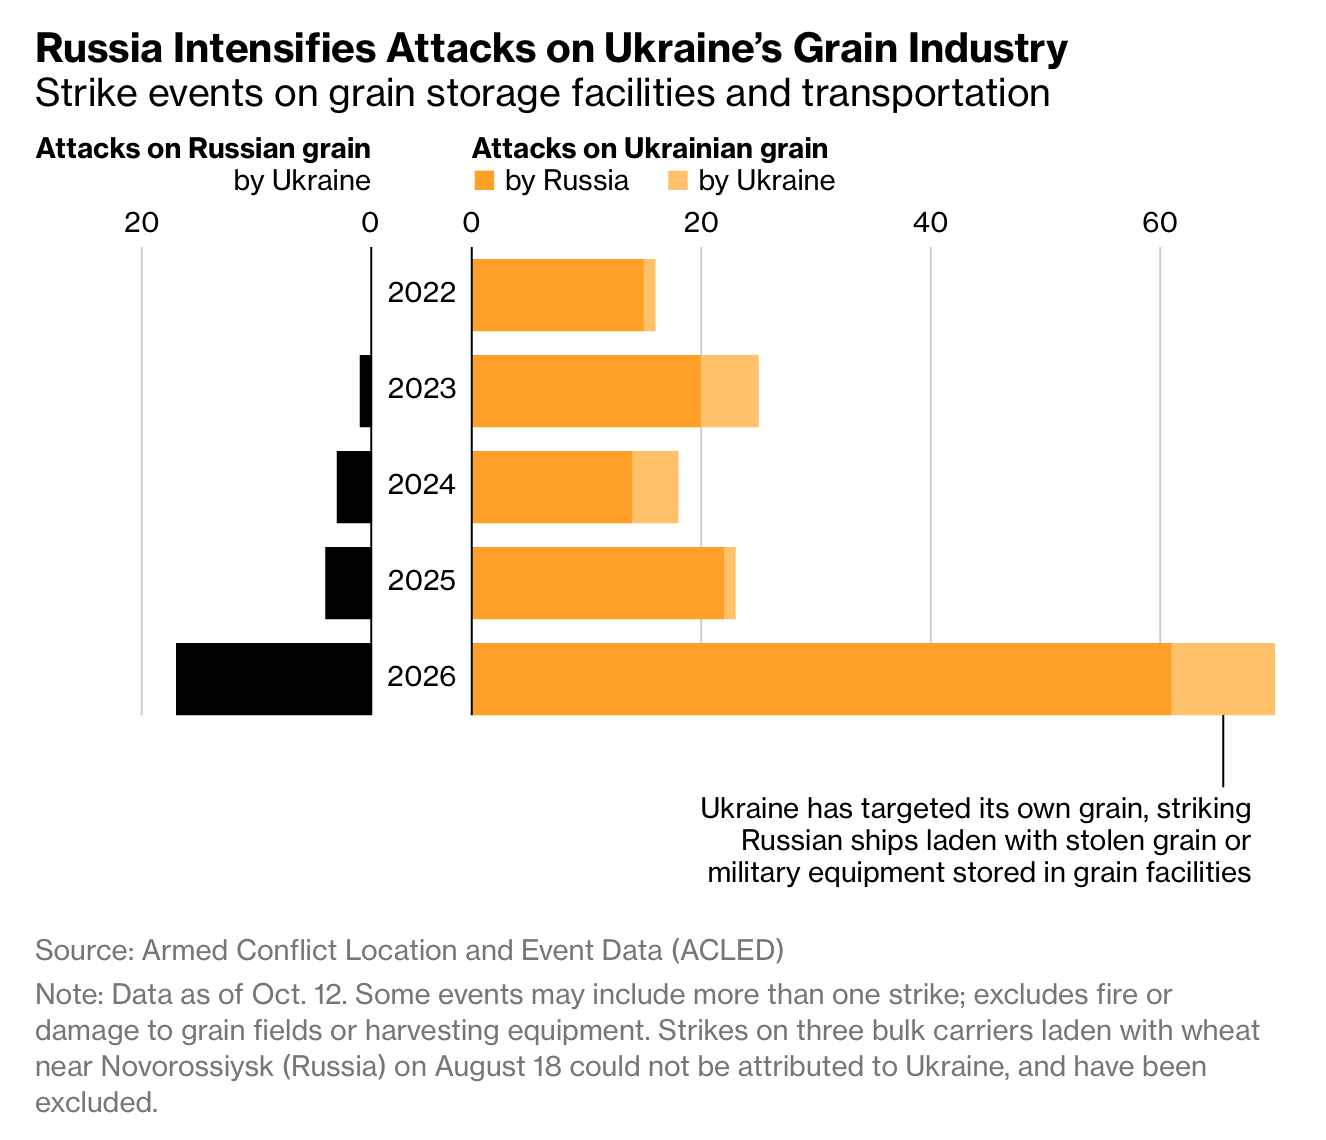
Source: Bloomberg
Paid subscribers get access to the other four charts: Chinese lending, Russia’s economic size, alternative GDP rankings and European renewable power. Together, they show why the reach of a state depends on connections and infrastructure as well as output.
