
OpenAI’s planned cash burn is insane
Five chart to start your day


For $10 a month, or $100 a year, you support a simple mission: spread great data visualisation wherever it comes from. You help fund the work of finding, sourcing and explaining the charts that deserve a wider audience. And you back a publication built on generosity, transparency and the belief that better understanding makes a better world.CHART 1 • OpenAI’s planned cash burn is insane
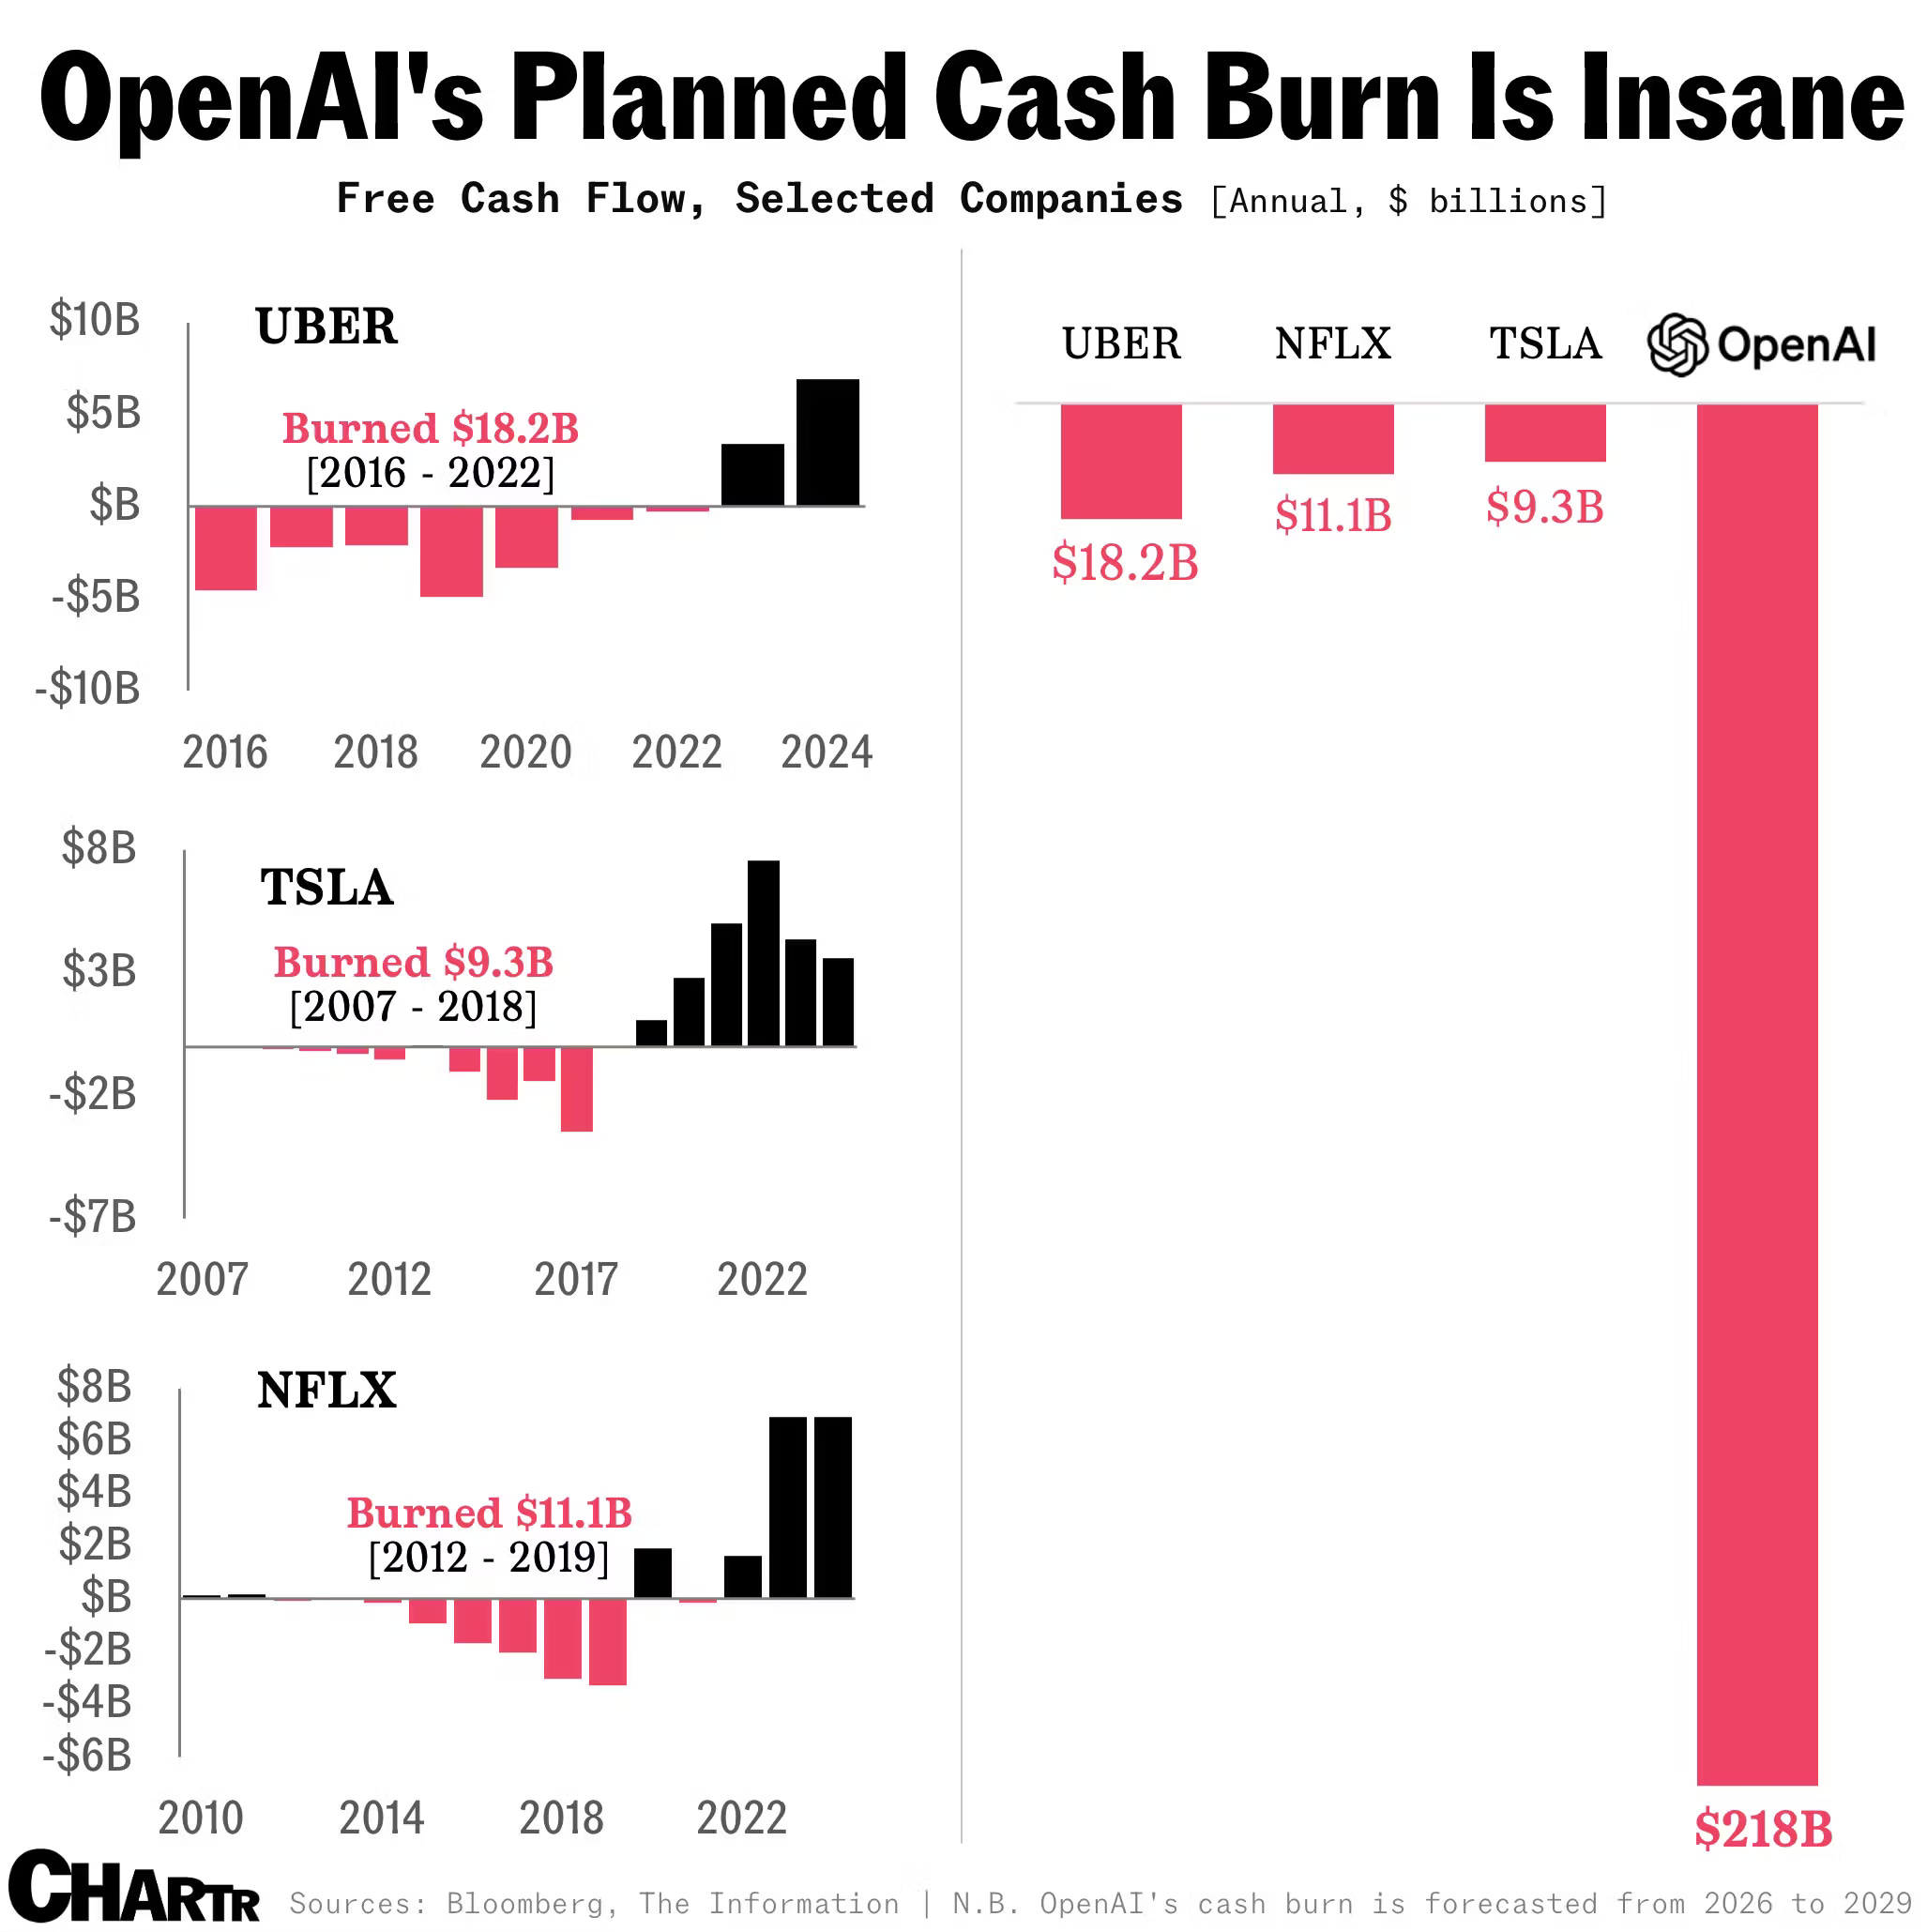
Uber burned $18.2 billion before it turned cash flow positive. Netflix burned $11.1 billion. Tesla $9.3 billion. Each of those numbers felt extraordinary at the time, and each was eventually vindicated by the business that emerged on the other side.
OpenAI’s forecasted cash burn through 2029 is $218 billion.
This is roughly twelve times what Uber spent during its lossmaking years, and Uber was considered one of the most capital-hungry startups in history. The comparison is not just striking, it reframes the entire conversation about what OpenAI actually is. This is not a startup burning cash on its way to profitability, but rather an infrastructure buildout on a scale that has no precedent in the history of venture-backed technology.
The bull case is that compute is to AI what content was to Netflix or manufacturing was to Tesla. You have to spend first, and the returns follow once the model is embedded deeply enough in how the world works. The bear case is that $218 billion in forecasted losses assumes a competitive moat that does not yet exist, in a market where Google, Microsoft, Meta and a growing list of open source alternatives are all spending aggressively to prevent exactly that moat from forming.
Source: Chartr
This is no longer a technology cycle. It is a capital cycle.
The common thread is scale. Scale of spending, scale of margins, scale of cash, scale of strategic dependency. AI is not simply a software story. It is a contest over who can finance, supply and control the infrastructure that everything else will run on.
I have four more charts that extend this story, including what past capital cycles tell us about eventual returns and risk. They are in the paid edition. Consider joining if you want the full analysis and the complete set of charts.
