
Major gold discoveries have stalled
Five charts to start your day


For $10 a month, or $100 a year, you support a simple mission: spread great data visualisation wherever it comes from. You help fund the work of finding, sourcing and explaining the charts that deserve a wider audience. And you back a publication built on generosity, transparency and the belief that better understanding makes a better world.CHART 1 • Major gold discoveries have stalled
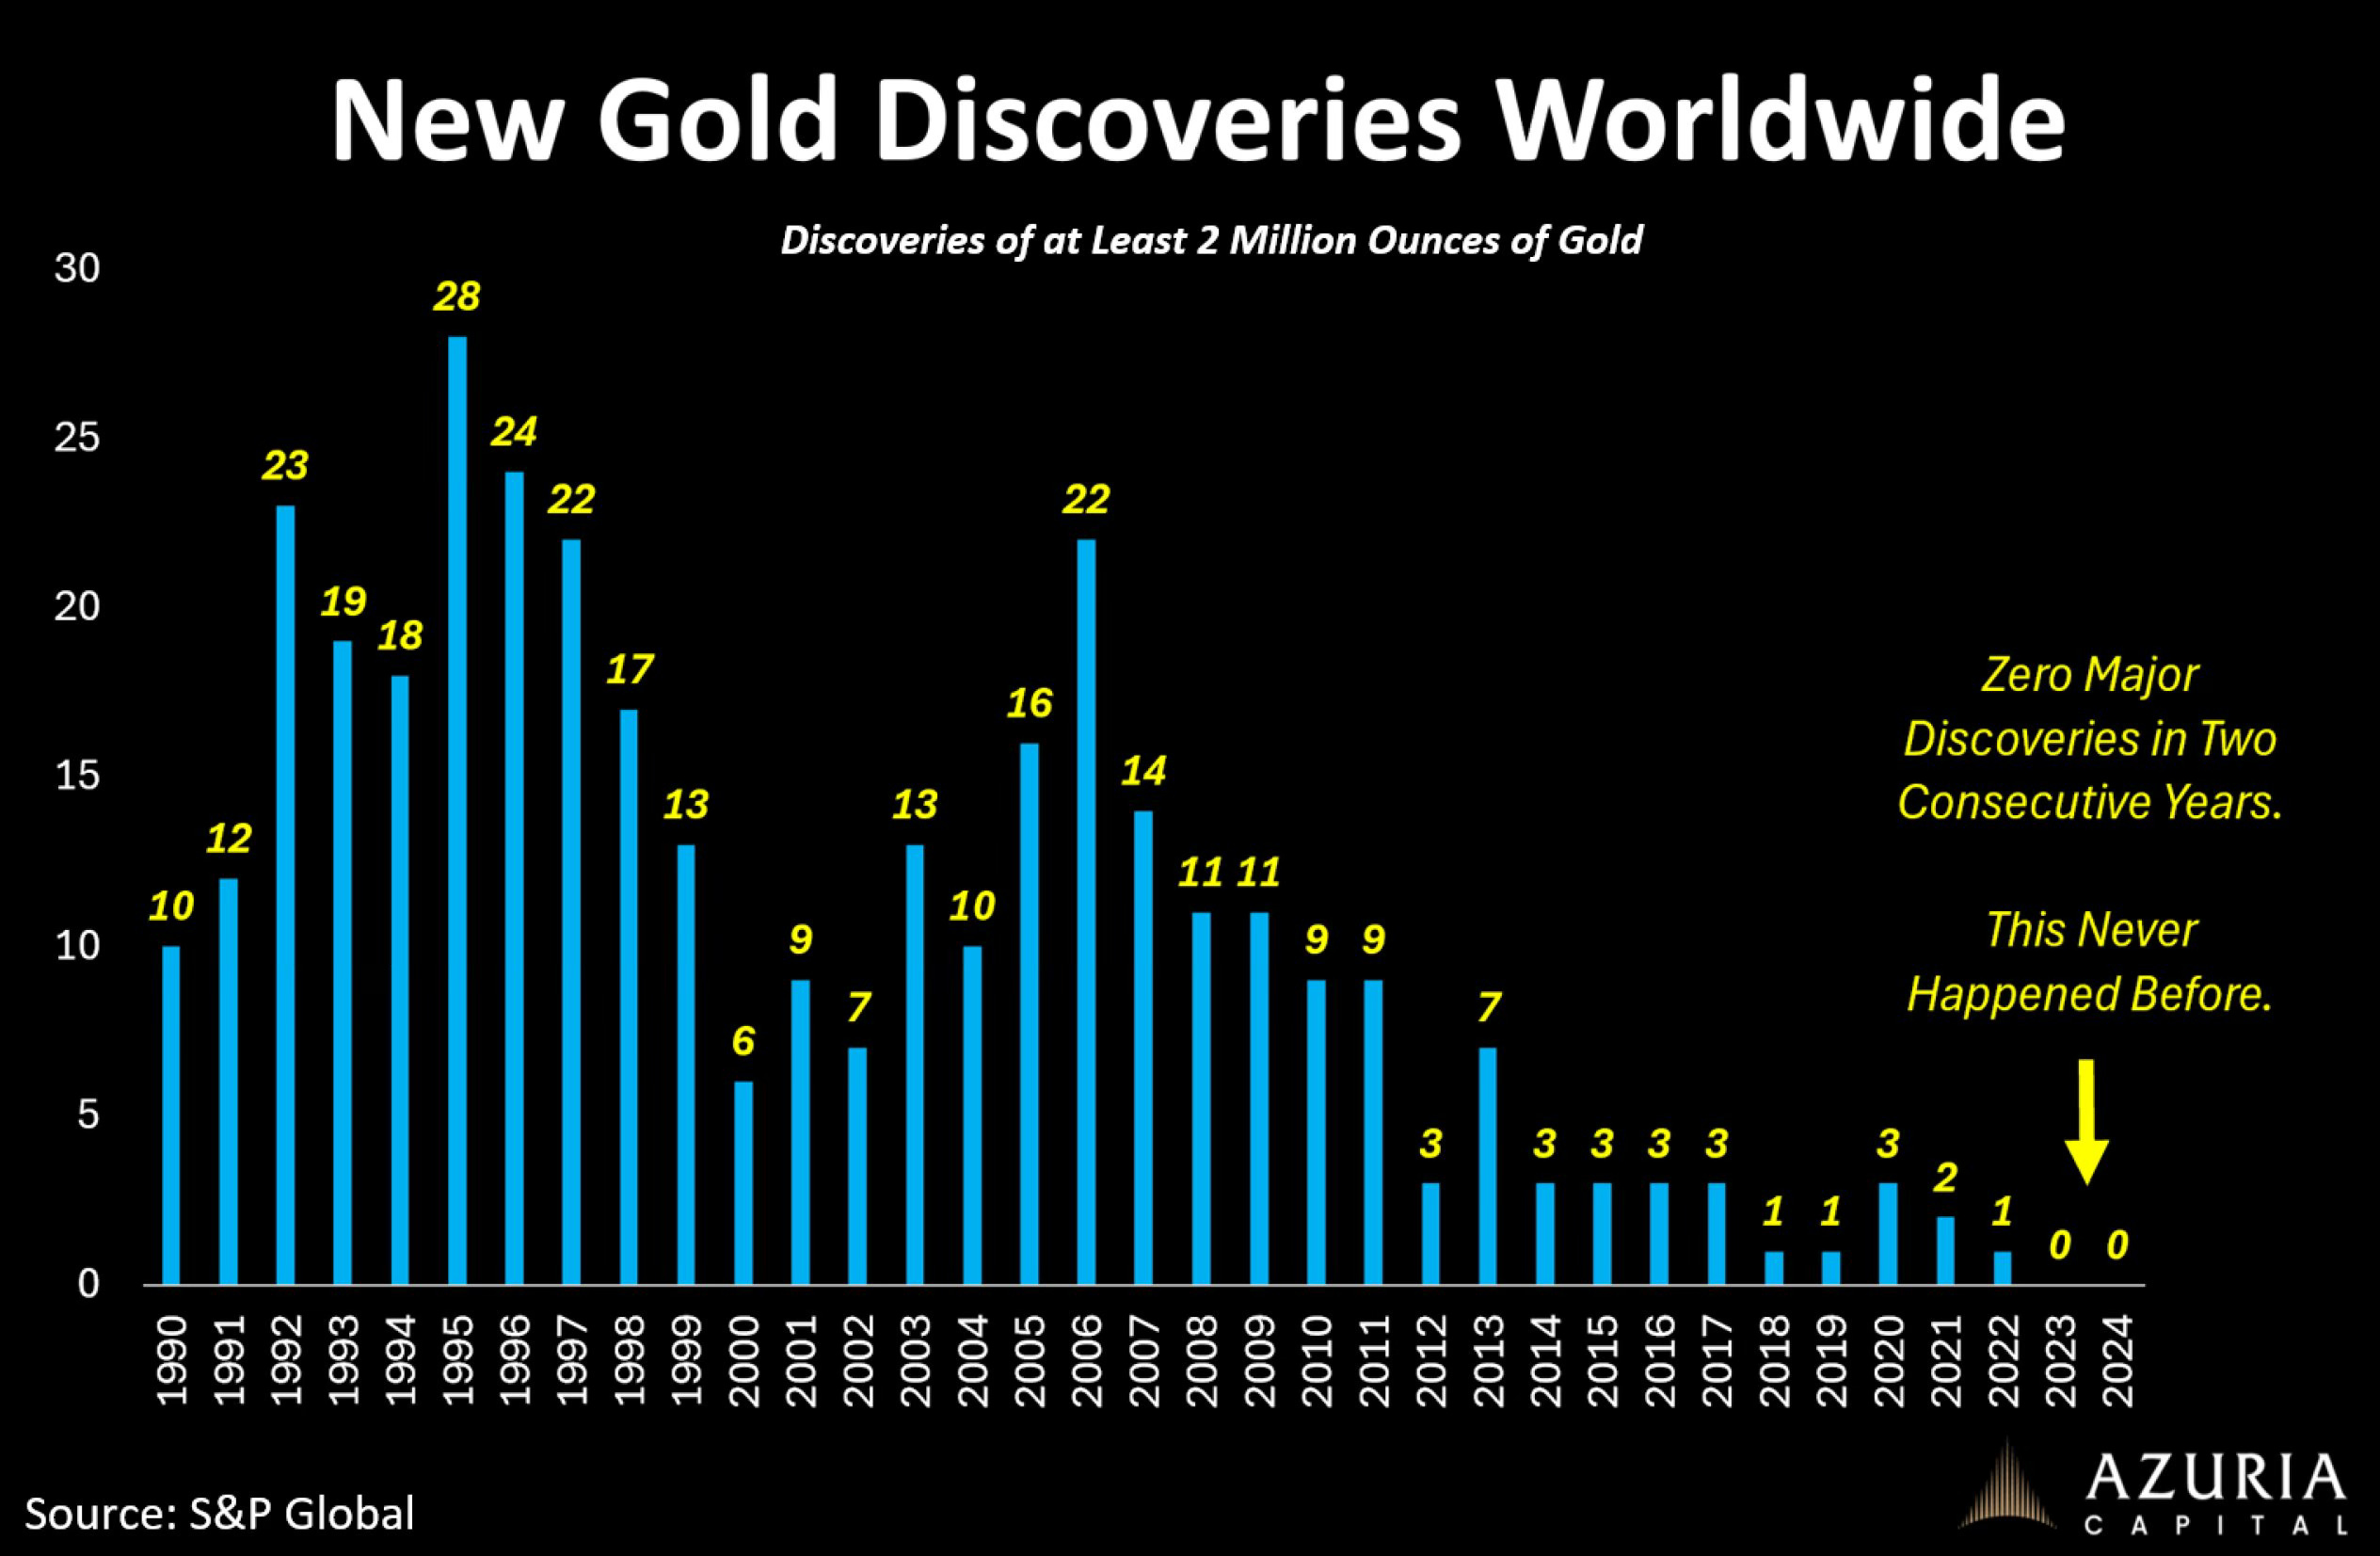
Gold prices are close to record highs. The discovery pipeline tells a different story. This chart shows the number of gold discoveries containing at least 2 million ounces falling from 28 in 1995 to zero in both 2023 and 2024. Two consecutive years without a single major discovery has not occurred before in the period shown.
The decline has been gradual rather than abrupt. Through the 1990s and mid 2000s, annual discoveries regularly reached double digits. In 2006 there were 22. After 2011, the trend turned decisively lower. By the late 2010s, new large deposits were scarce. Now they are absent.
This is not merely cyclical. Exploration spending was cut sharply after the post 2011 commodity downturn, but budgets alone do not explain the pattern. The most accessible, high grade deposits have largely been identified. New finds tend to be deeper, more technically complex or located in jurisdictions with greater political and regulatory risk. Geological depletion and capital discipline are working in the same direction.
Gold supply does not collapse overnight. Mines operate for decades and recycling adds flexibility. But without large new discoveries entering the development pipeline, future production growth becomes harder to sustain. In commodity markets, long lags matter.
Source: Octavio (Tavi) Costa
What strikes me is how often markets oscillate between impatience and neglect. We overreact to short term price swings, yet underappreciate slow moving constraints like geological depletion or the mathematics of compounding.
I have four more charts that deepen this theme and explore where long lags may create the next surprises, but they are for paid subscribers. If you want the full edition and the broader perspective behind it, consider joining.
