
Magnificent Seven earnings growth slows
Five chart to start your day


Quick note — Killer Charts has been $8/month and $80/year since launch two years ago. From 1 December the price for new subscribers will rise to $10/month and $100/year. If you’ve been meaning to upgrade, you can lock in the old rate for life here.CHART 1 • Magnificent Seven earnings growth slows
The mega cap tech group known as the Magnificent Seven has become a major engine of earnings growth across the market. When a small number of companies drive such a large share of profits, the health of the entire market rests on their shoulders.
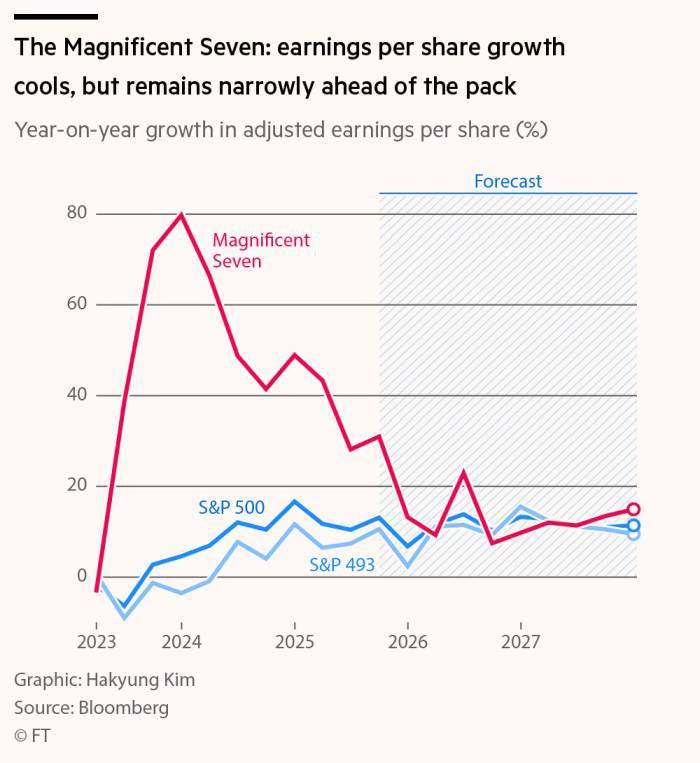
This chart from the Financial Times shows earnings per share growth for this group surging into the 70% range in 2024, while the broader index sat in the low teens. That gap is now narrowing. Growth for the Magnificent Seven is cooling to more modest levels and the rest of the market is beginning to catch up. This shift matters because it hints at a move from concentrated risk toward broader based momentum.
The key point is simple. The Magnificent Seven still lead, but they no longer own the story outright. Does that mean investors should rethink strategy and ask where the next wave of earnings growth is likely to come from?
Source: Financial Times
When a small group of companies powers most of the market’s earnings, any cooling in their growth becomes more than a footnote. Strength is never static. It has to be constantly rebuilt, rediscovered and reassessed.
I have four more charts that develop this further, but they are for paid subscribers. Consider joining if you would like the full edition.
