

For $10 a month, or $100 a year, you support a simple mission: spread great data visualisation wherever it comes from. You help fund the work of finding, sourcing and explaining the charts that deserve a wider audience. And you back a publication built on generosity, transparency and the belief that better understanding makes a better world.
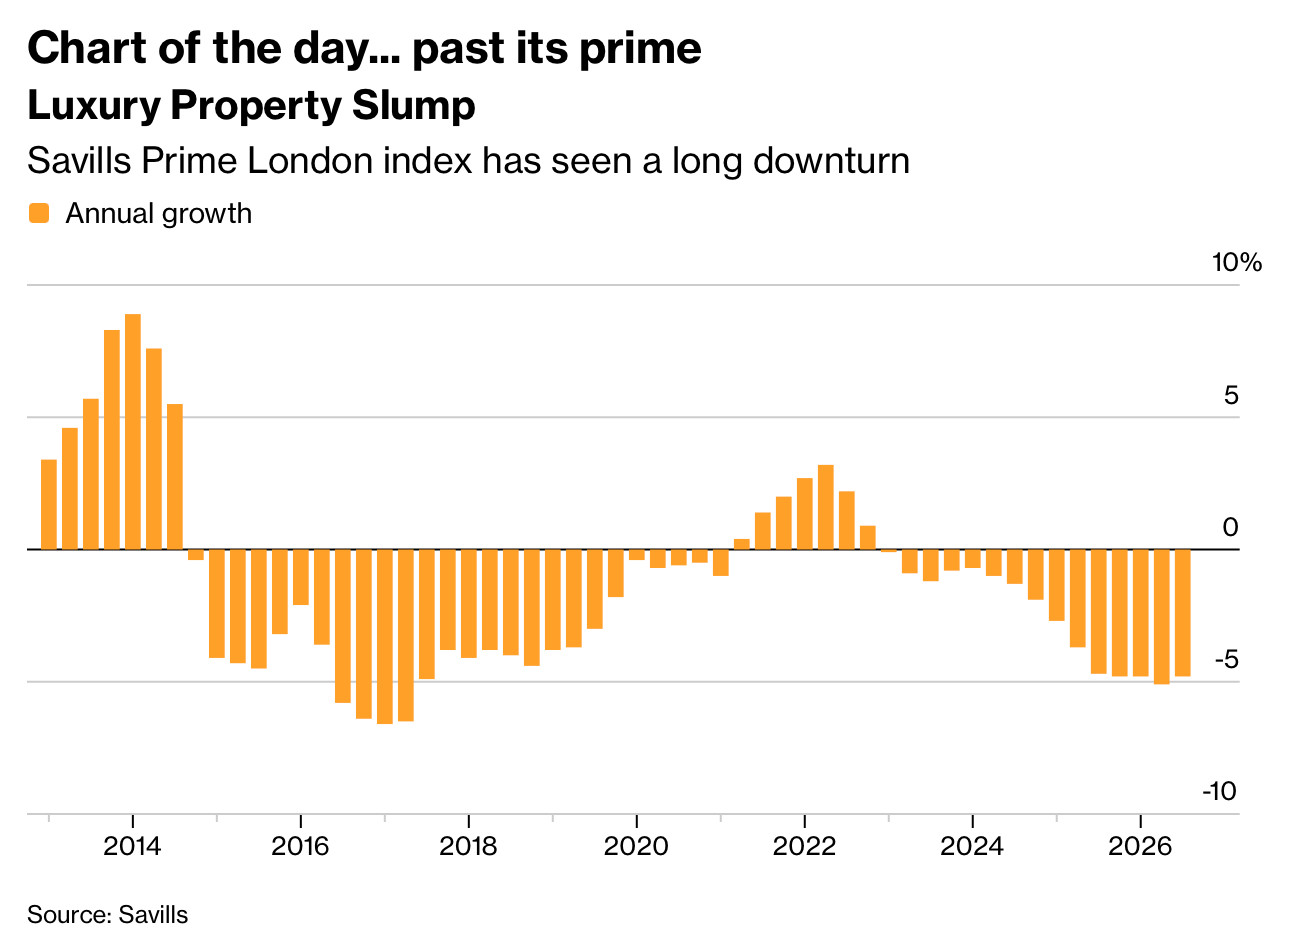
CHART 1 • London’s luxury property market slump
As I am originally from London, a small part of me cheered when I saw this chart. Now let me be clear, I’m also a homeowner and I own a property in a prime location in London. But I also worry deeply about the city and the cost of living.
What I found frustrating was the way property in London is treated more like an asset class than a home where a family might live. I think this can be deeply destructive for the economic health of a city, and can make future economic growth unsustainable.
Firstly, luxury property in the UK became a place for wealthy foreigners to park their assets as a store of wealth. This in turn pushed up property prices across the capital. Several factors also contributed to that trend, which is not often talked about. Huge amounts of money have also been laundered through London. Luxury properties have also remained vacant while ordinary Londoners struggle to buy or rent.
But there’s also another worrying trend that counteracts what we see here. It might also perhaps be a sign of the wealthy quitting London following Brexit and the changes made in stamp duty and non-dom tax breaks.
I nonetheless believe that the city needs a bit more rebalancing in order for it to sustainably thrive and continue growing. Let’s hope that is what we are seeing here.
Source: Bloomberg
Paid subscribers get access to the other four charts: city GDP per person, Germany’s rent divide, Swiss innovation and Canadian bilingualism. Together, they show why national success often depends on differences that become visible only at city and regional level.
