

For $10 a month, or $100 a year, you support a simple mission: spread great data visualisation wherever it comes from. You help fund the work of finding, sourcing and explaining the charts that deserve a wider audience. And you back a publication built on generosity, transparency and the belief that better understanding makes a better world.
CHART 1 • JPMorgan’s profit is getting costlier
Have a look at this Sankey chart by App Economy Insights on JPMorgan Chase. Its commercial and investment banking business is absolutely booming right now and contributes more revenue than its consumer banking business (albeit marginally).
This is an interesting development, driven by a mixture of solid prime brokerage revenue and commercial banking opportunities that the bank has benefited from strongly over the past year.
Obviously, like most banks, JPMorgan Chase has sizeable overheads. Its net income is very healthy for a bank of this size. The bank appears to still be growing, and that growth is delivering profit. However, the concern now is that converting growth into profit is becoming less forgiving.
In its defence, the bank’s breadth, higher loan balances and rising interest rates have helped boost interest income. Meanwhile, equities trading and asset management fees help cushion revenue from swings.
Ultimately, we still have to address the operating expenses. Although the bank has generated growth over the years, this is more evidence of resilience than effortless scaling up. It has successfully diversified its earnings growth, and that has been managed well, but the environment remains tough for the bank.
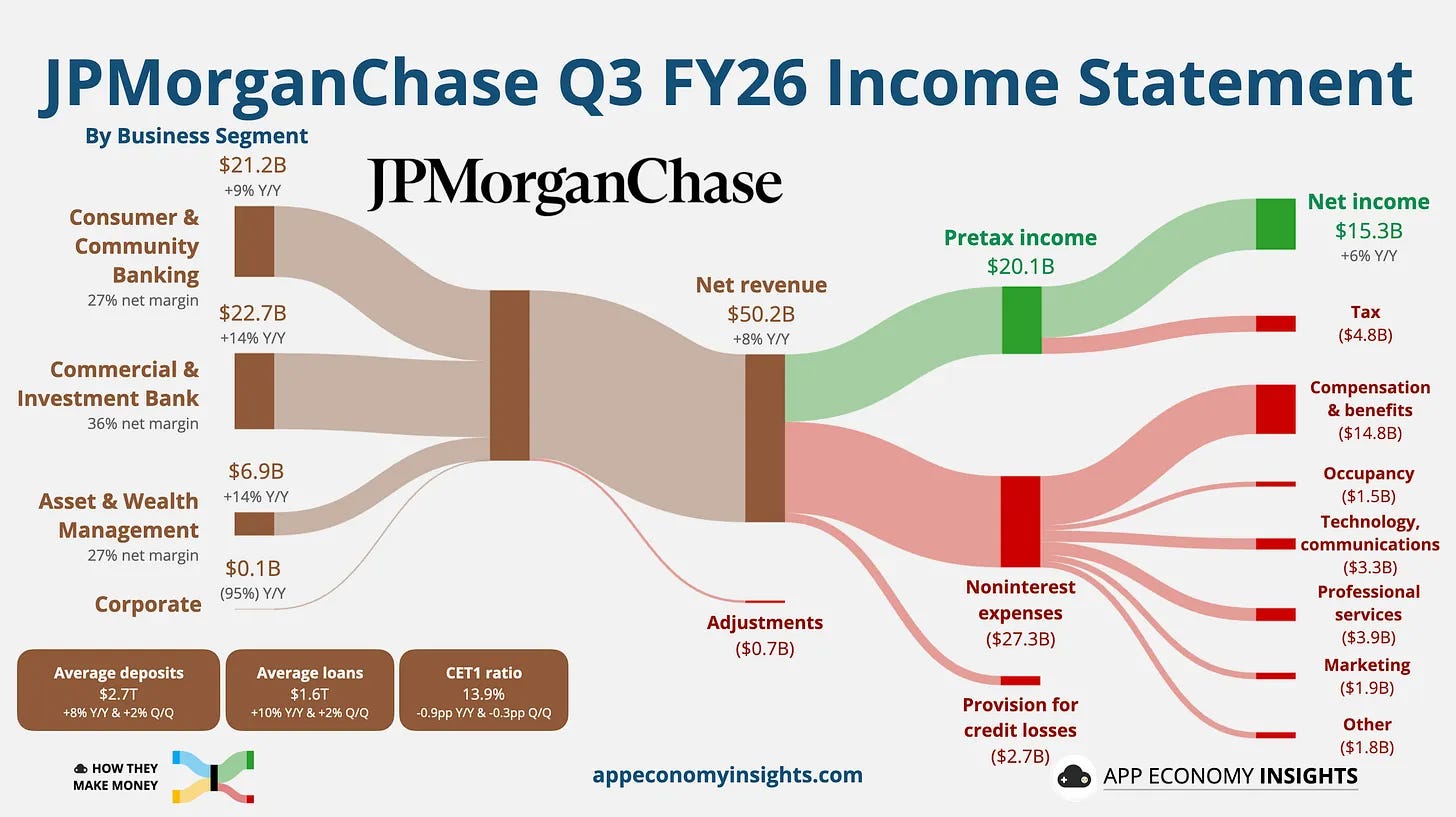
Source: App Economy Insights
Paid subscribers get access to the other four charts: hedge-fund revenues, G7 borrowing costs, unequal defence pacts and Brazil’s share of South America. Together, they show how financial and geopolitical weight changes both protection and vulnerability.

