


For $10 a month, or $100 a year, you support a simple mission: spread great data visualisation wherever it comes from. You help fund the work of finding, sourcing and explaining the charts that deserve a wider audience. And you back a publication built on generosity, transparency and the belief that better understanding makes a better world.
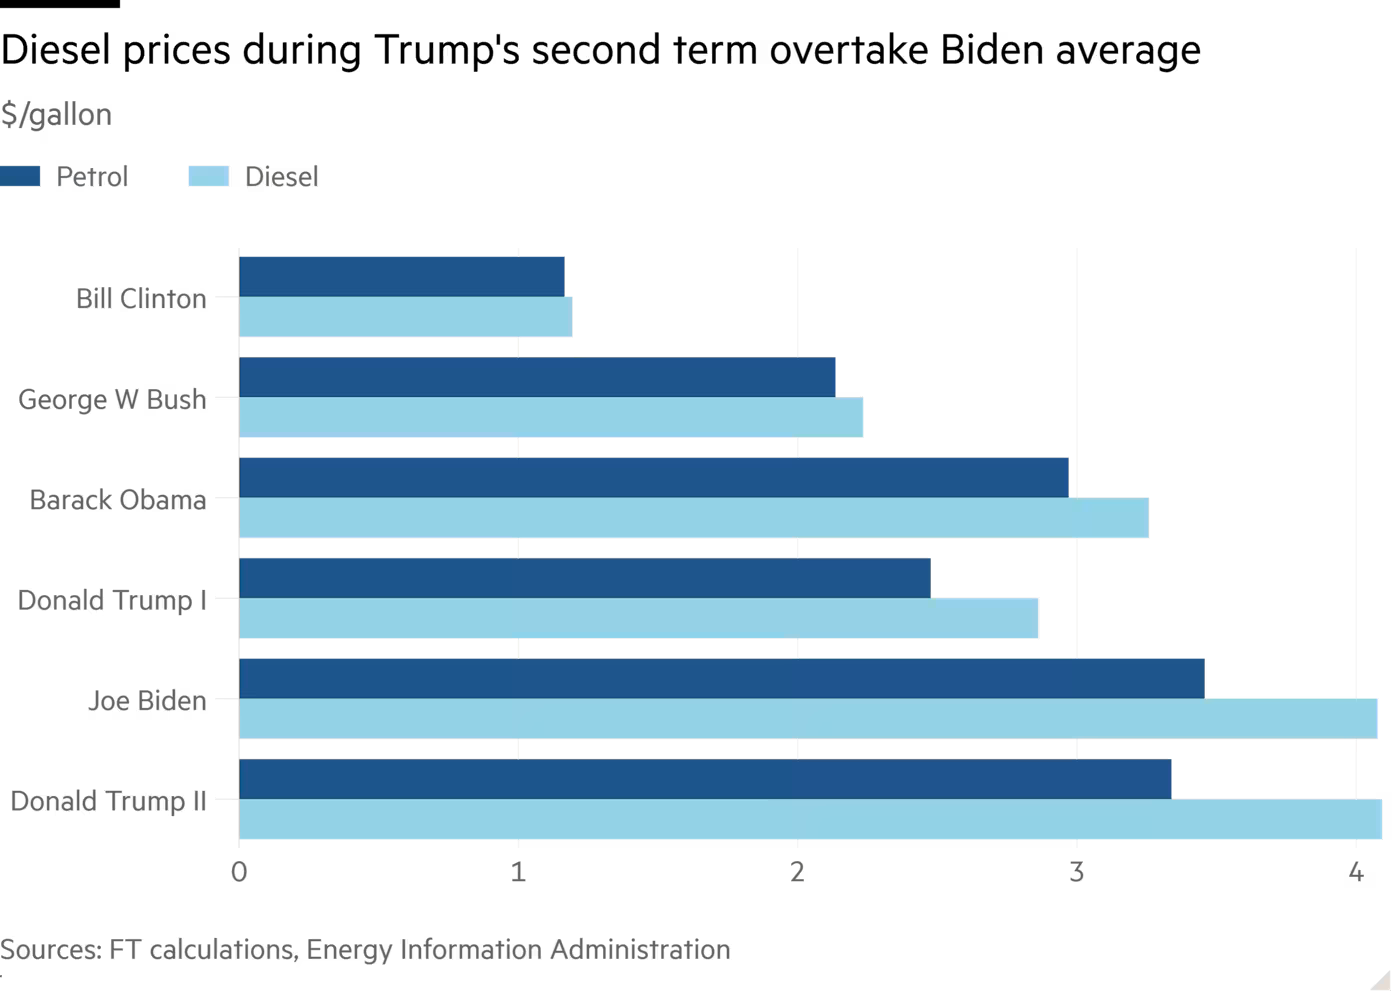
CHART 1 • Iran war pushes up US diesel prices
When Donald Trump returned to office for a second term, he promised relief from inflation. Lower fuel costs initially supported his promise to reduce household costs.
The US-Israeli campaign against Iran, however, which began on 28 February, may have derailed that goodwill. Iran has effectively closed the Strait of Hormuz, a crucial route for oil shipments, restricting supply and lifting diesel prices.
Diesel averaged $4.09 a gallon during Trump’s second term by the time of this comparison, one cent above Biden’s full-term average. It reached $5.26 on 10 August. Stocks of diesel and heating oil were 10% below their five-year average, even as US refineries operated at 96.1% capacity.
Source: Financial Times
This leaves little room to replace the disrupted supply of diesel quickly. Diesel is important because it powers lorries, farm machinery and construction equipment, so its cost travels into food, deliveries and manufactured goods. The risk here for Trump is that it opens an inflation problem before the midterm elections.
Paid subscribers get access to the other four charts: Hormuz oil shocks, Rhine freight, the economics of milk and commodity export dependence. Together, they show how physical constraints turn distant events into local costs.
