
How to visualise Earth’s daylight hours in D3 JavaScript
JavaScript tutorial

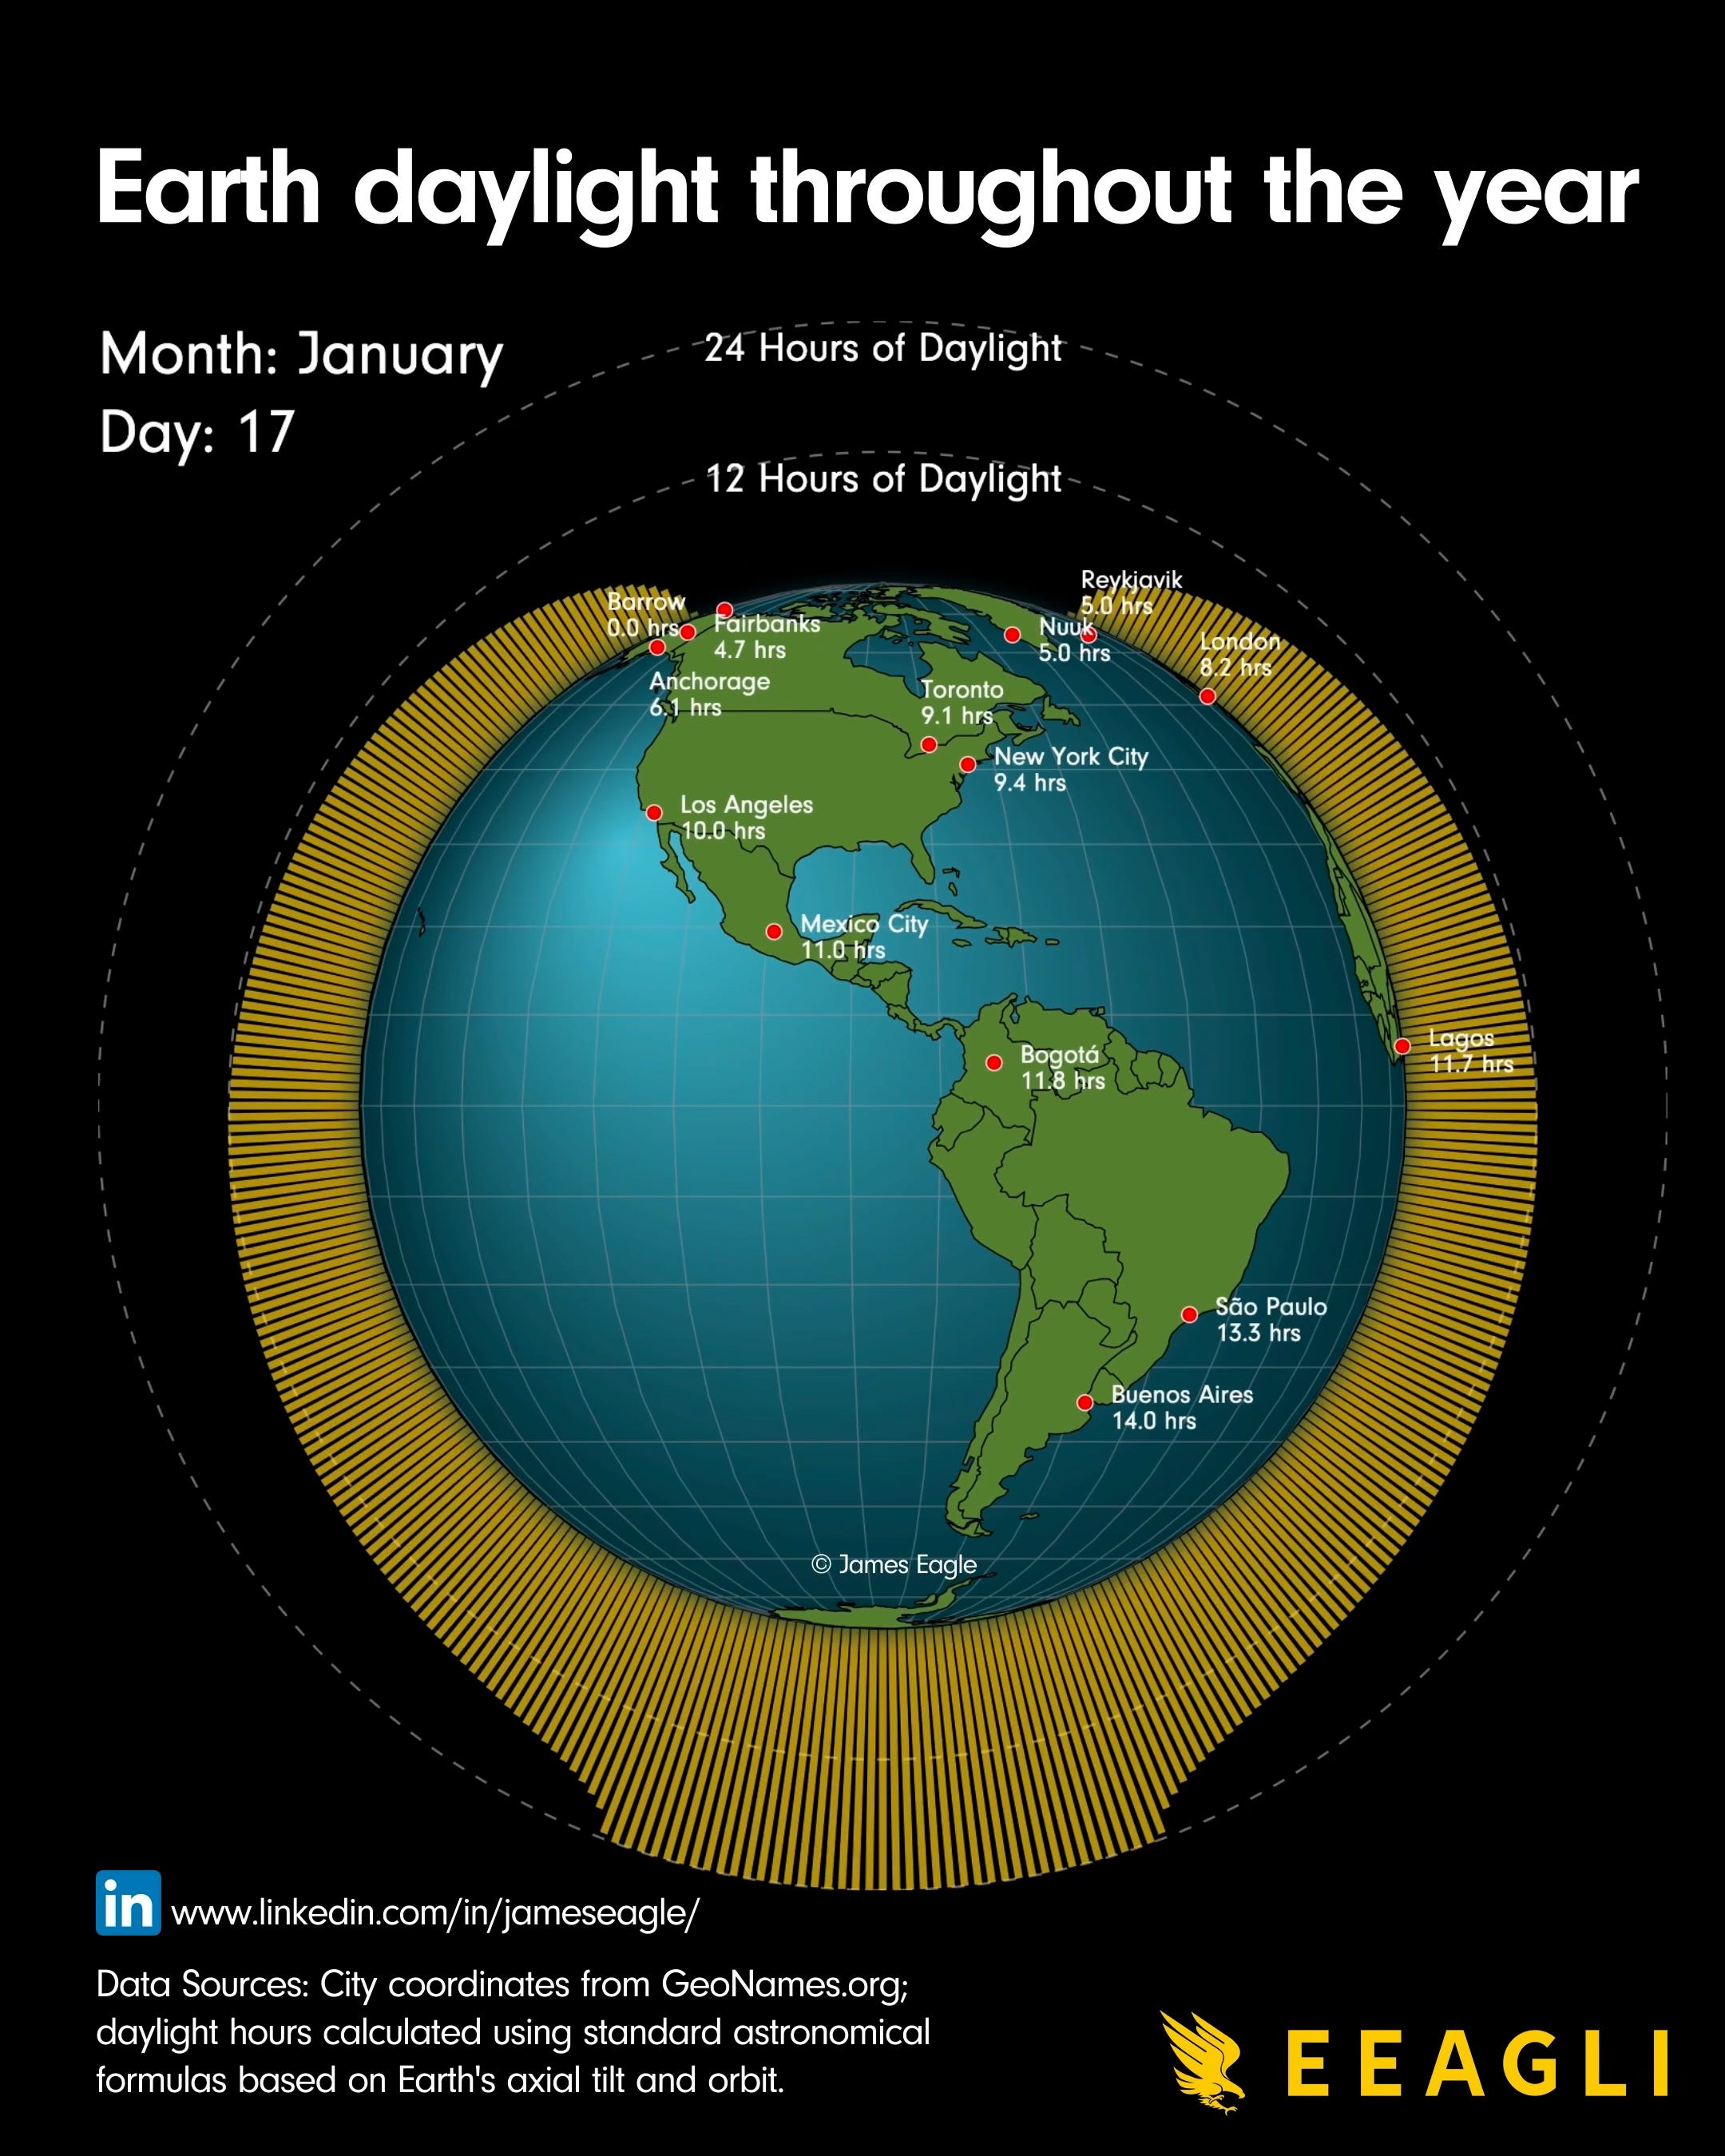
I've put this tutorial together to show you how to create the data visualisation that you may have seen me publish on LinkedIn a few weeks ago. This tutorial will show you how to replicate it using JavaScript – in particular, I'll be using D3, which is a JavaScript library.
The feedback I received from my previous data visualisation suggested it was a bit complicated to follow. While I've aimed to make this clearer, it's still not a beginner tutorial – if you're new to JavaScript, I suggest you complete an online course first to become familiar with coding in JavaScript.
To run this visualisation, I'll be using Visual Studio Code (VS Code) with the Live Server extension. After installing VS Code, you can add Live Server by clicking the Extensions icon in the sidebar, searching for 'Live Server', and installing it. Once installed, simply right-click your index.html file and select 'Open with Live Server'. This will launch your visualisation in your default web browser and automatically refresh it whenever you make changes to your code – making the development process much smoother.
Prerequisites
Basic knowledge of HTML, CSS, and JavaScript
Familiarity with D3.js (helpful but not required)
Project Setup: create a new project folder and the following files:
index.html: The main HTML file
styles.css: The stylesheet for styling the visualisation
app.js: The JavaScript file containing D3.js code
