
How Netflix makes its money
Five charts to start your day


Good morning – here are your five chart for the day.
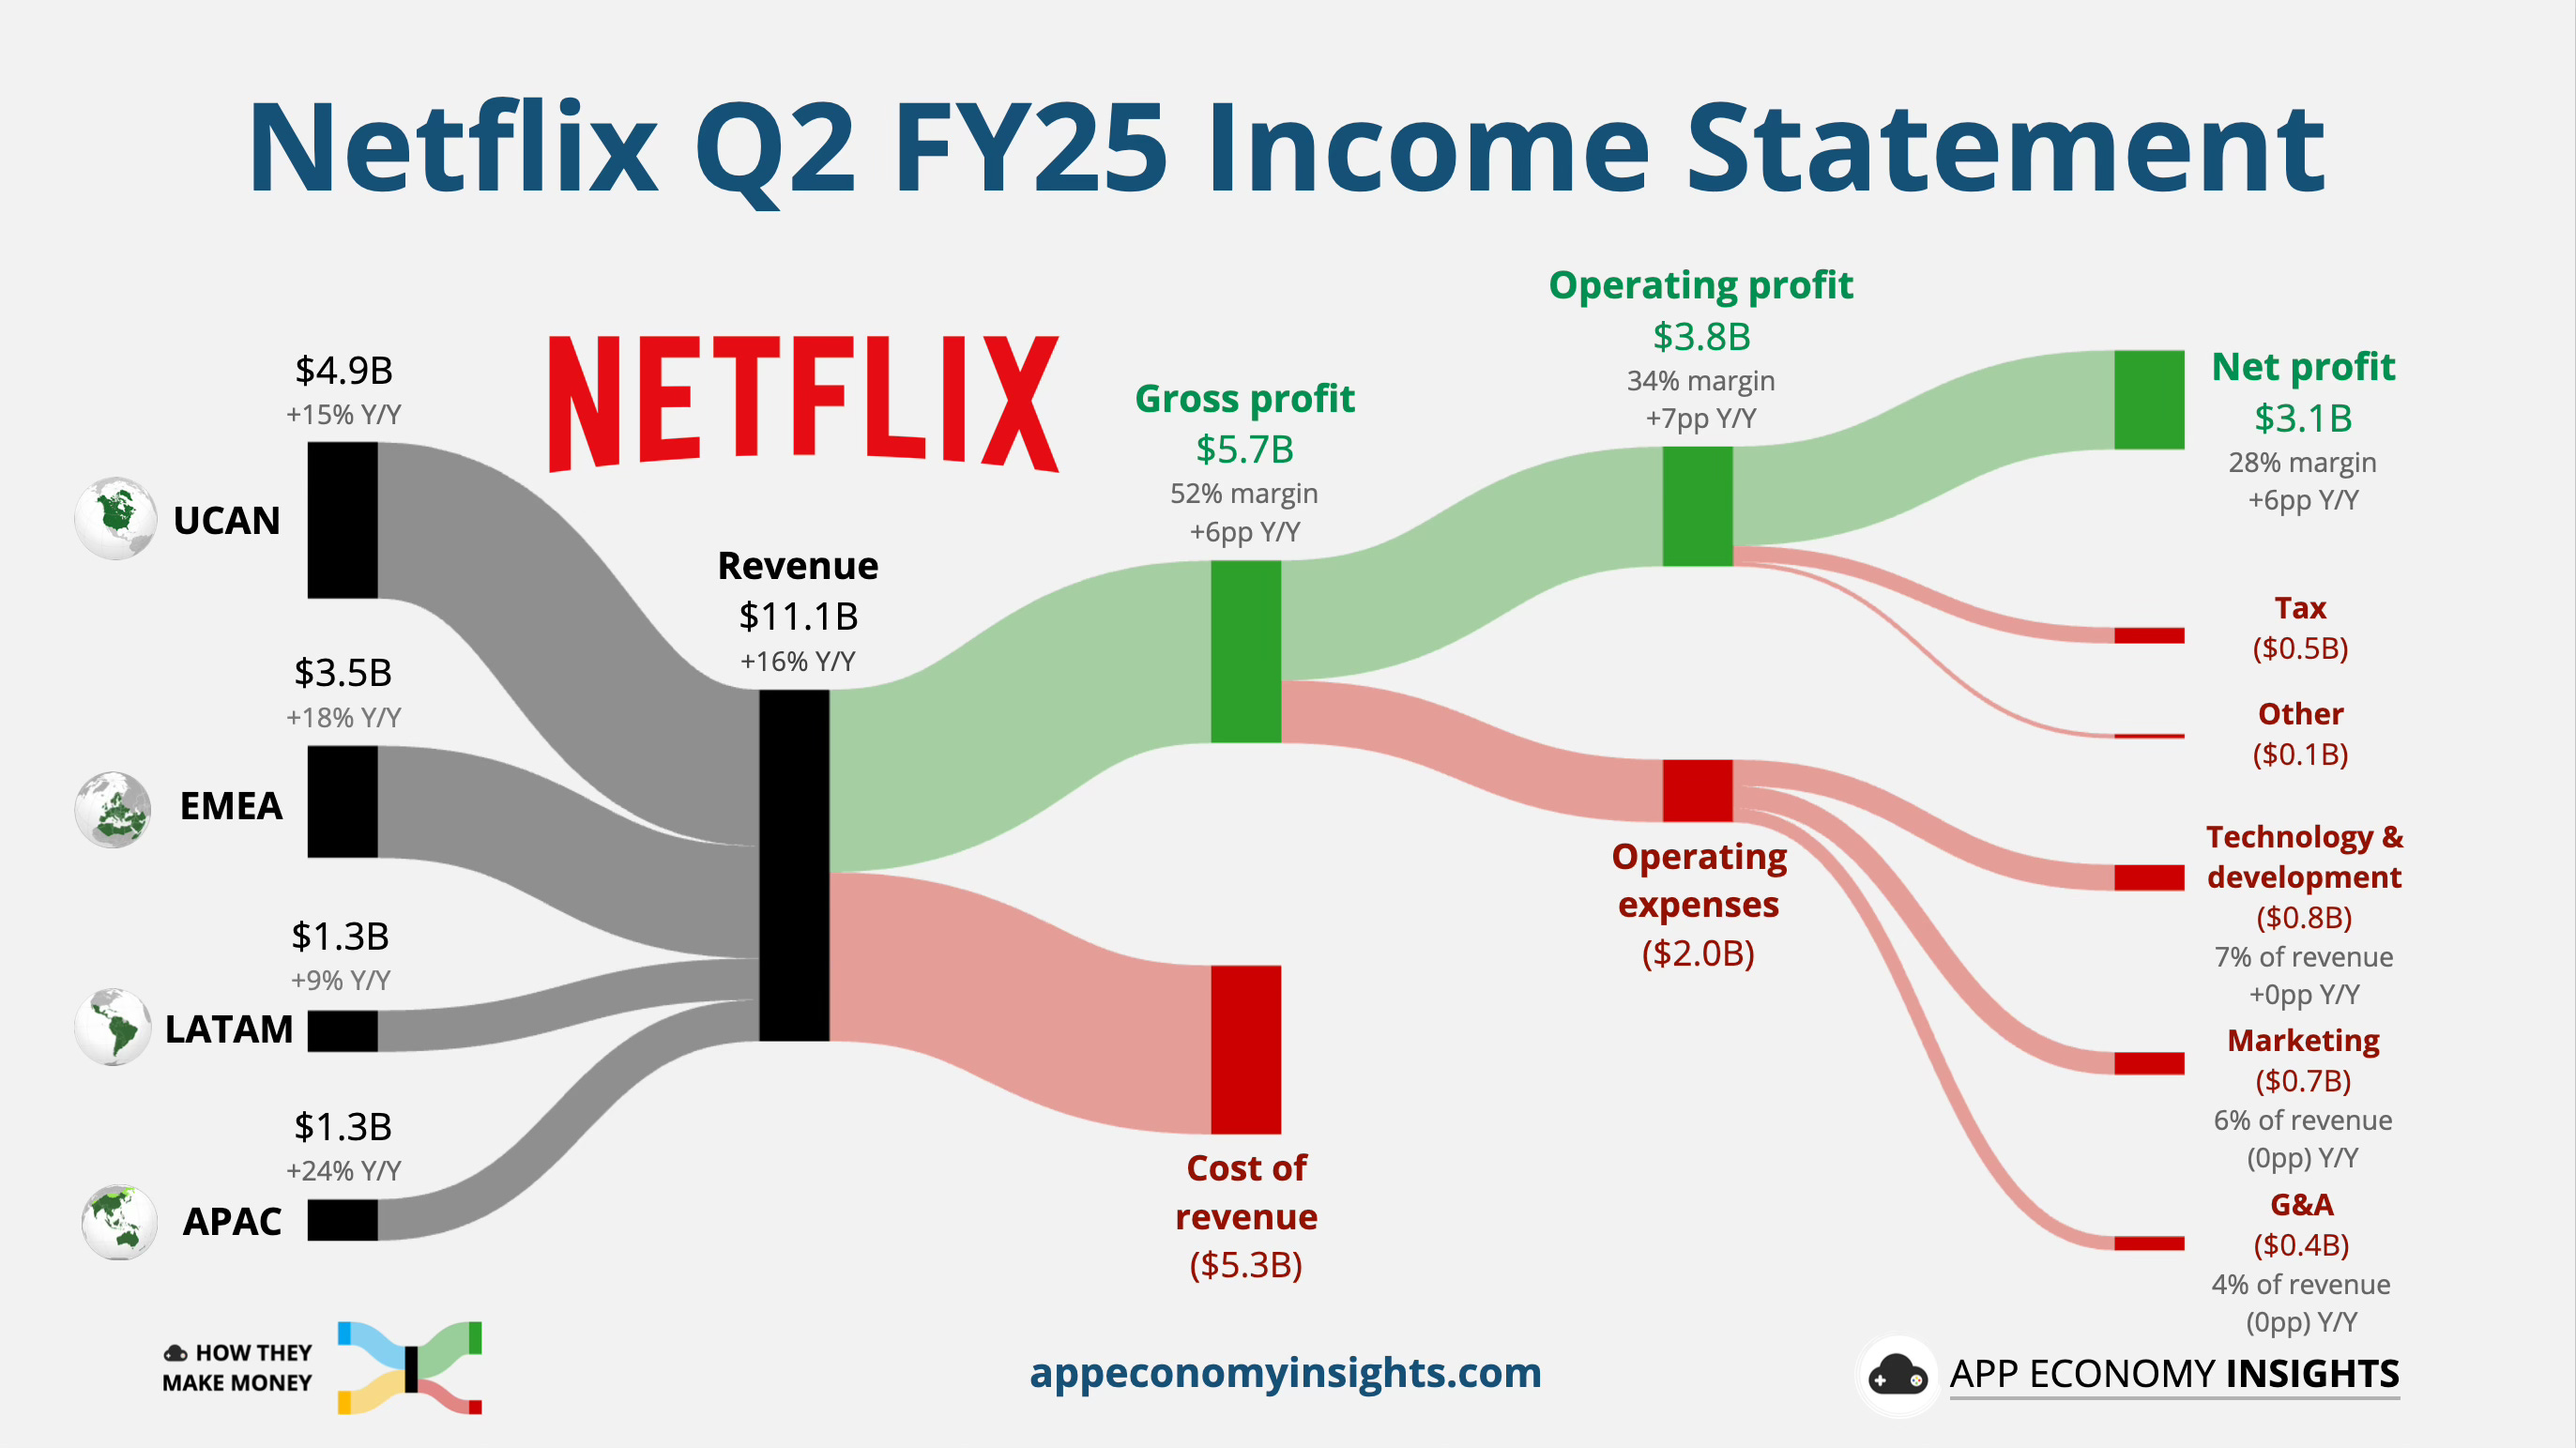
CHART 1 • Netflix's profit machine fires on all cylinders
Netflix's Q2 results show a company that's finally mastered the art of printing money. Revenue jumped 16% to $11.1 billion, but the real story is how they're squeezing every penny. Operating margins hit 34%. That's up seven percentage points from last year.
The streaming giant raised its full-year revenue forecast to $45.2 billion, driven by what executives call "healthy" member growth and ad momentum. Netflix is on track to roughly double its advertising revenue this year, with the ad-supported tier now boasting 94 million monthly users. That's a 135% surge from last year.
Here's what's brilliant: Netflix stopped reporting subscriber numbers because they've moved beyond the growth-at-all-costs phase. They're now a cash-generating machine targeting $8 billion in free cash flow for 2025. Price increases in the US and Canada boosted revenue growth from 9% to 15% quarter-on-quarter. With Stranger Things and Wednesday returning in the second half, plus live sports deals including Christmas Day NFL games, Netflix has built an engagement moat that competitors can't touch.
Source: App Economy Insights
Want the other four? Become a paid subscriber.
