
How does bank lending really works?
Five charts to start your day


Right! So this first chart has a massive backstory, and I need to tell it because otherwise, it won’t make a lot of sense. It all starts with how banks work. Many people believe that when a bank gives out a loan, it's taking money from other customers' deposits and lending it out.
Well, perhaps that was the case in the old days, but not anymore. What banks actually do is create new money. Yes! They “print” money.
So here’s how it happens:
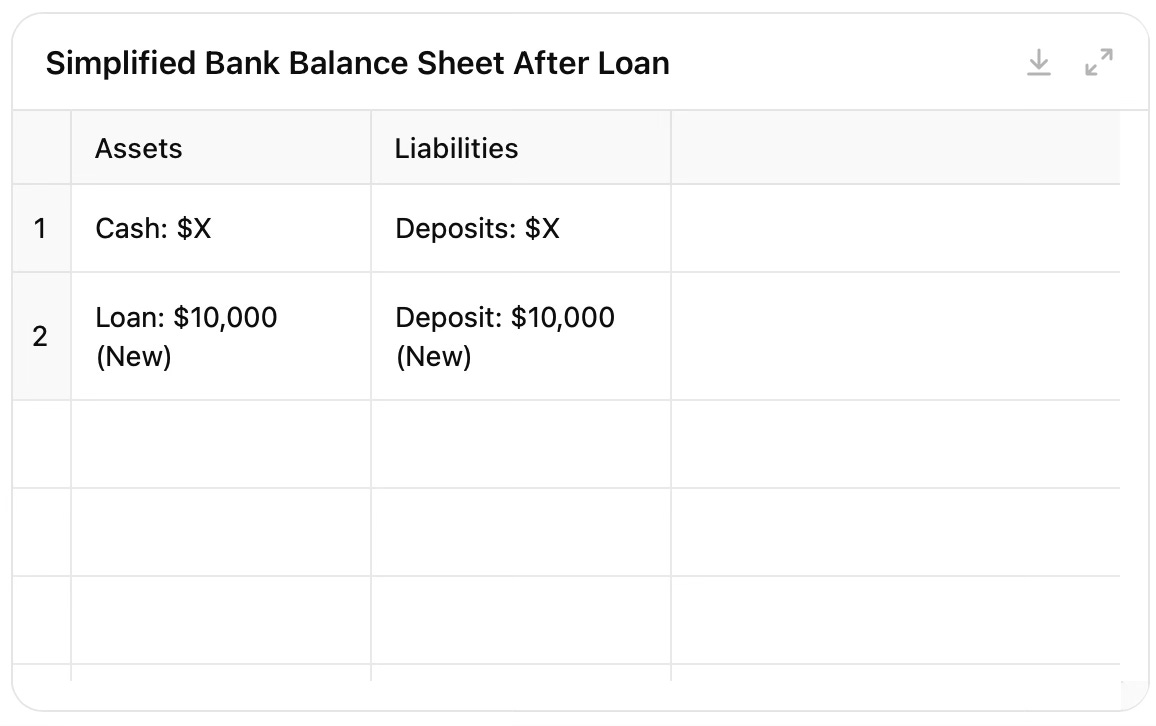
When a bank approves your loan, they don't transfer existing money to you. Instead, they simply create a new entry in their accounting system.
They add the loan amount as an asset for the bank (because you owe them money now).
At the same time, they create a matching deposit in your account as a liability (because you can now withdraw this money).
This ability of banks to create money through lending is a key part of how modern economies function. What does this mean for the economy?
Let’s visualise this!
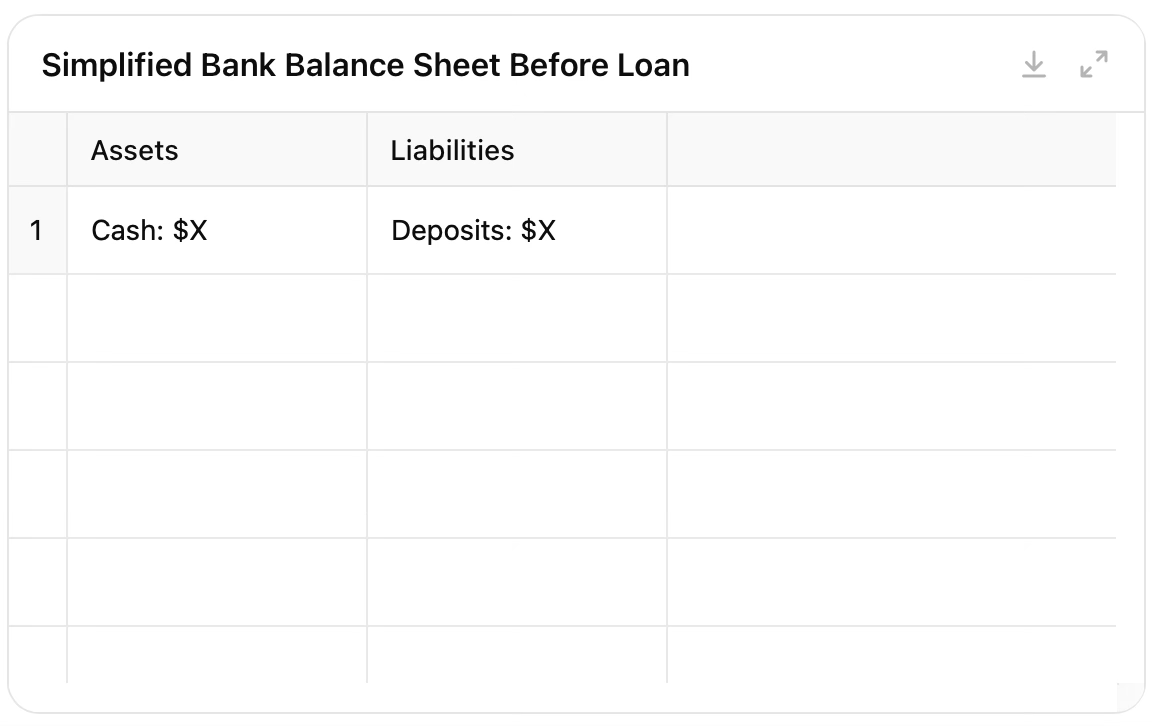
Before the loan:
Total money supply = Existing deposits
After the loan:
Total money supply = Existing deposits + $10,000 (a newly created deposit)
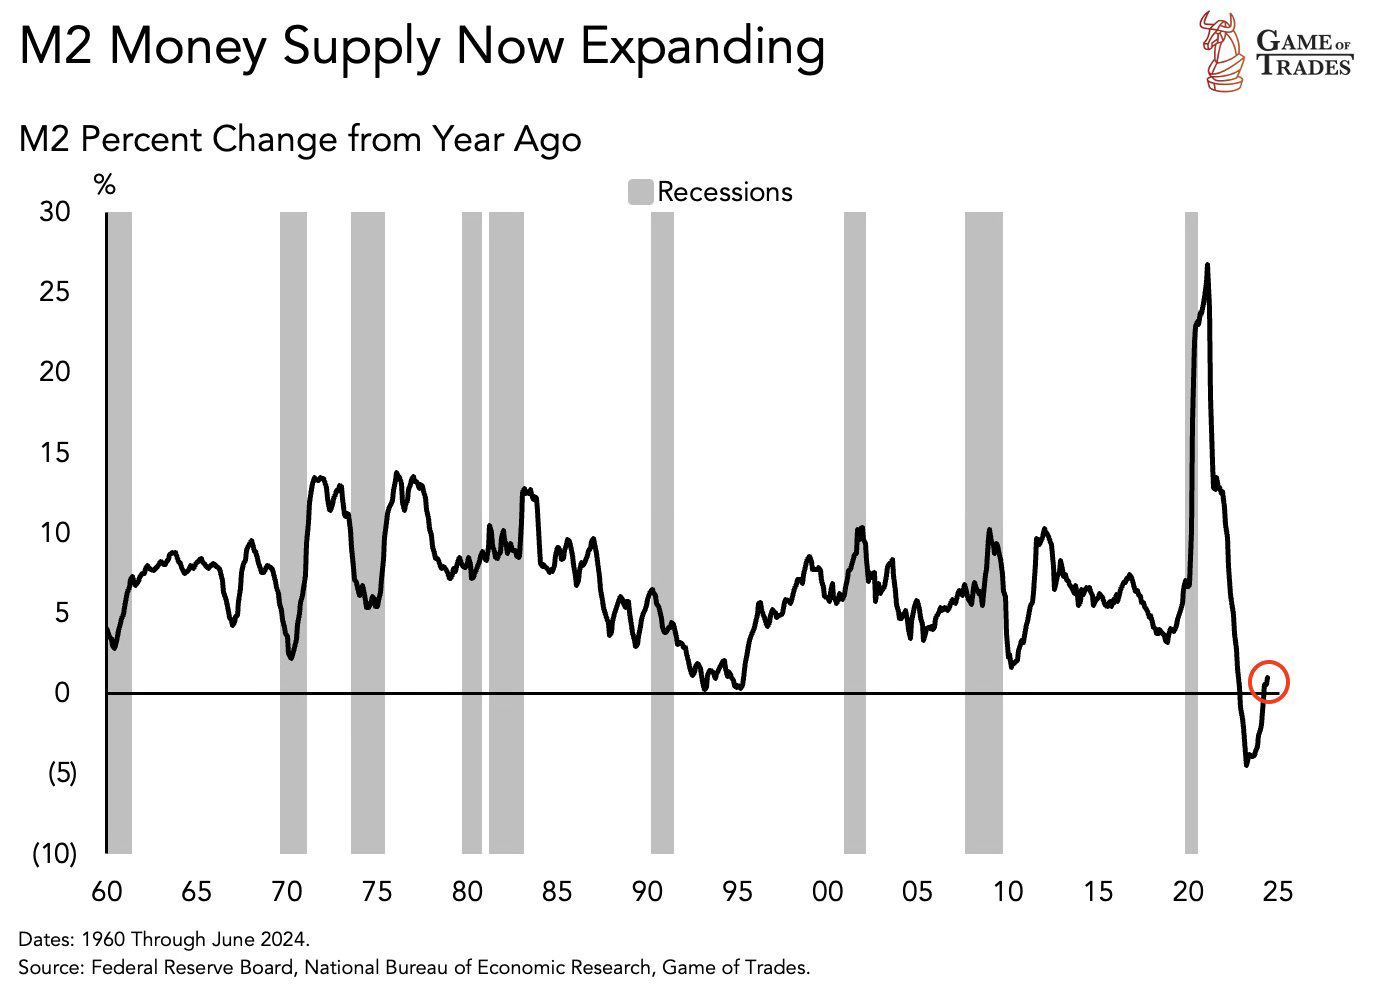
So, money has been created out of thin air through an accounting entry on the bank’s balance sheet. This increases the money supply in the economy, and this is what we see in the first chart.
But here’s where it gets interesting – this process is not just about “printing” money. It's also a form of financial intermediation. When the bank creates that deposit, it’s not just creating money; it’s also creating a new security. The loan agreement (or IOU) becomes an asset for the bank and a liability for you.
This is similar to how bonds or stocks are issued, where new financial instruments are created that represent assets and liabilities. So, while the money supply increases, this increase is tied to the creation of a corresponding liability, reflecting the loan you now owe the bank.
Source: Game of Trades
The most striking feature of this chart is the massive spike in money supply growth during the Covid-19 pandemic, driven by the Fed's very low-interest rates and government stimulus payments. This sharp increase in the M2 money supply was necessary to support the economy during a period of unprecedented uncertainty. However, as inflation began to rise, the Fed had to respond by raising interest rates, leading to a sharp reversal in M2 growth, which turned negative.
This situation highlights the delicate balancing act that the Fed faces. Managing money supply growth is crucial – too much can cause inflation, as we saw during the pandemic, while too little can lead to a recession. The goal is to maintain price stability, typically targeting around 2 percent inflation.
If you look at the red circle at the end of the chart, you'll see that M2 growth has recently turned positive again, but at a very moderate pace. This indicates that the Fed may have some room to cut interest rates in September without risking excessive inflation. However, this could change very quickly if money supply growth picks up once again.
Coming up:
Comparing interest rates of central banks worldwide
Global debt hits record $315 trillion
Top US companies by market value from 1950 to 2023
Growing performance gap between US and European stock markets
If you like the sound of that line up, this is usually a paid newsletter. You basically get all my best ideas daily. Hit the subscribe button if you are interested and this will be sent to your inbox daily.
