

For $10 a month, or $100 a year, you support a simple mission: spread great data visualisation wherever it comes from. You help fund the work of finding, sourcing and explaining the charts that deserve a wider audience. And you back a publication built on generosity, transparency and the belief that better understanding makes a better world.
CHART 1 • Greg Abel inherits Berkshire’s cash challenge
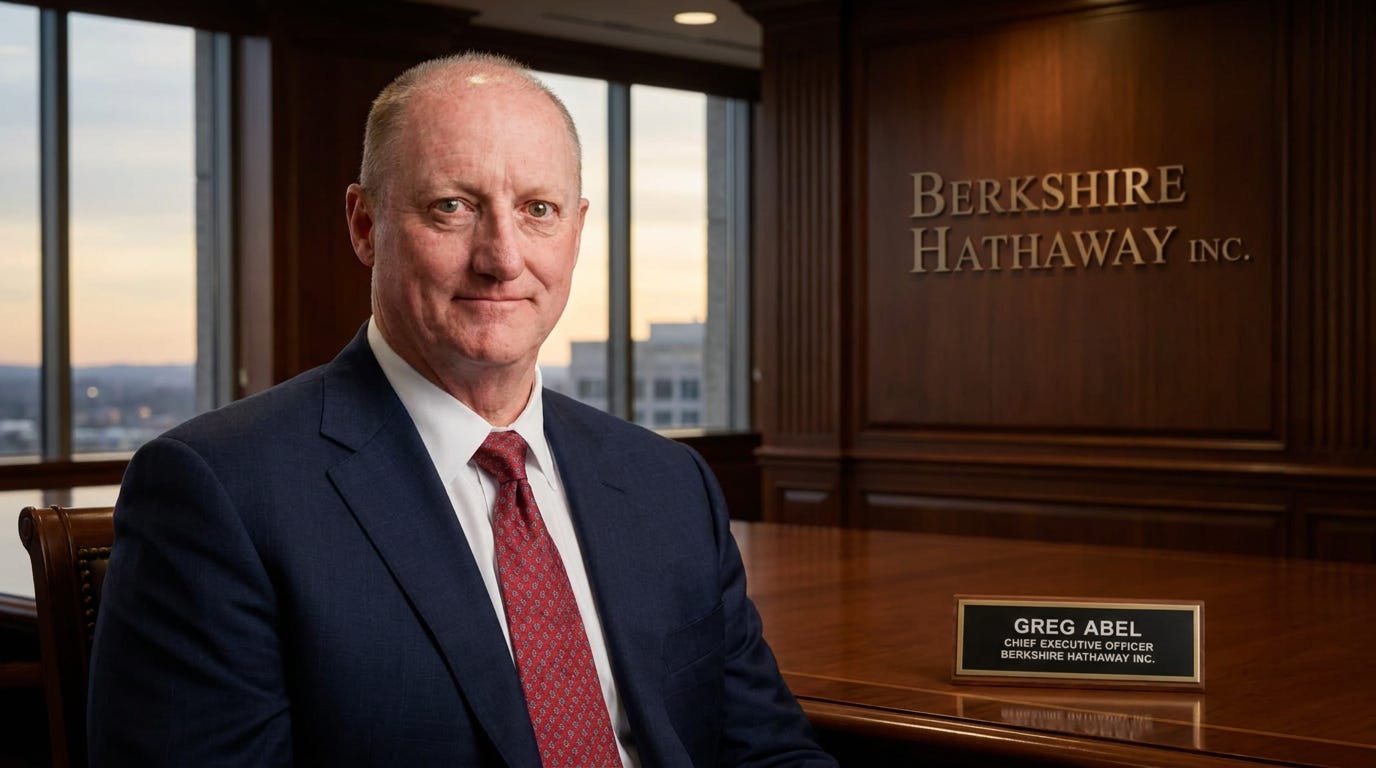
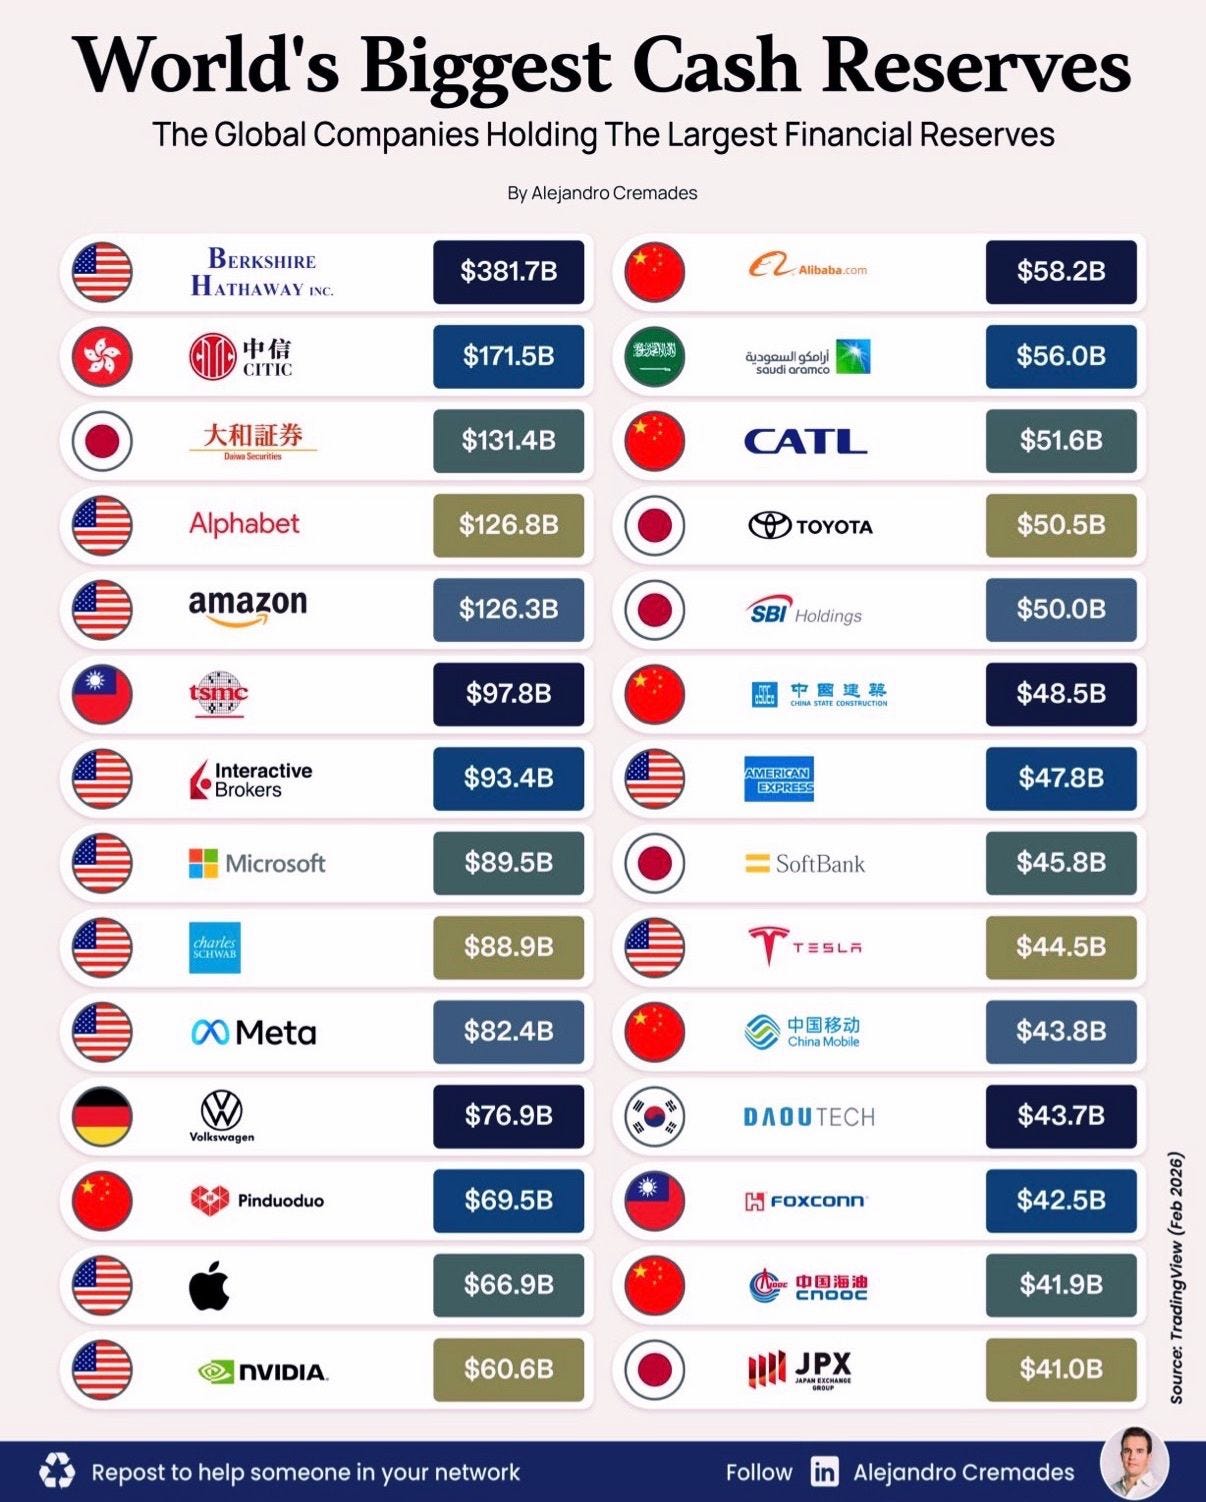
Greg Abel succeeded Warren Buffett as chief executive of Berkshire Hathaway on 1 January 2026. By the end of September 2025, Berkshire had amassed a vast reserve, held mainly in cash and US Treasury bills. It was more than twice the size of CITIC’s and larger than Alphabet and Amazon’s cash piles combined. Berkshire’s businesses had continued to generate huge amounts of cash, while Buffett largely resisted making major acquisitions as valuations climbed.
Source: INVEST
Abel has started deploying this cash. Berkshire bought $39.4 billion of listed shares in the first half of 2026 and repurchased $4.5 billion in the second quarter. Those purchases helped reduce the reserve from $397.4 billion in March to $365.5 billion in June, while cash generated by Berkshire’s businesses partly replenished it.
Banks, brokers, insurers and operating companies hold liquidity for different purposes, making comparisons imperfect here. The $6.8 billion Taylor Morrison acquisition used less than 2% of the June reserve. Small deals can also succeed without changing Berkshire’s returns. What Abel needs is investments large enough to matter, but overpaying would also destroy the advantage that Warren Buffett has gained by being a patient investor.
Paid subscribers get access to the other four charts: Michael Jordan’s brand income, flat beer production, London business robbery and SpaceX short positions. Together, they show how value depends on ownership, measurement and the behaviour of everyone on the other side.
