


For $10 a month, or $100 a year, you support a simple mission: spread great data visualisation wherever it comes from. You help fund the work of finding, sourcing and explaining the charts that deserve a wider audience. And you back a publication built on generosity, transparency and the belief that better understanding makes a better world.
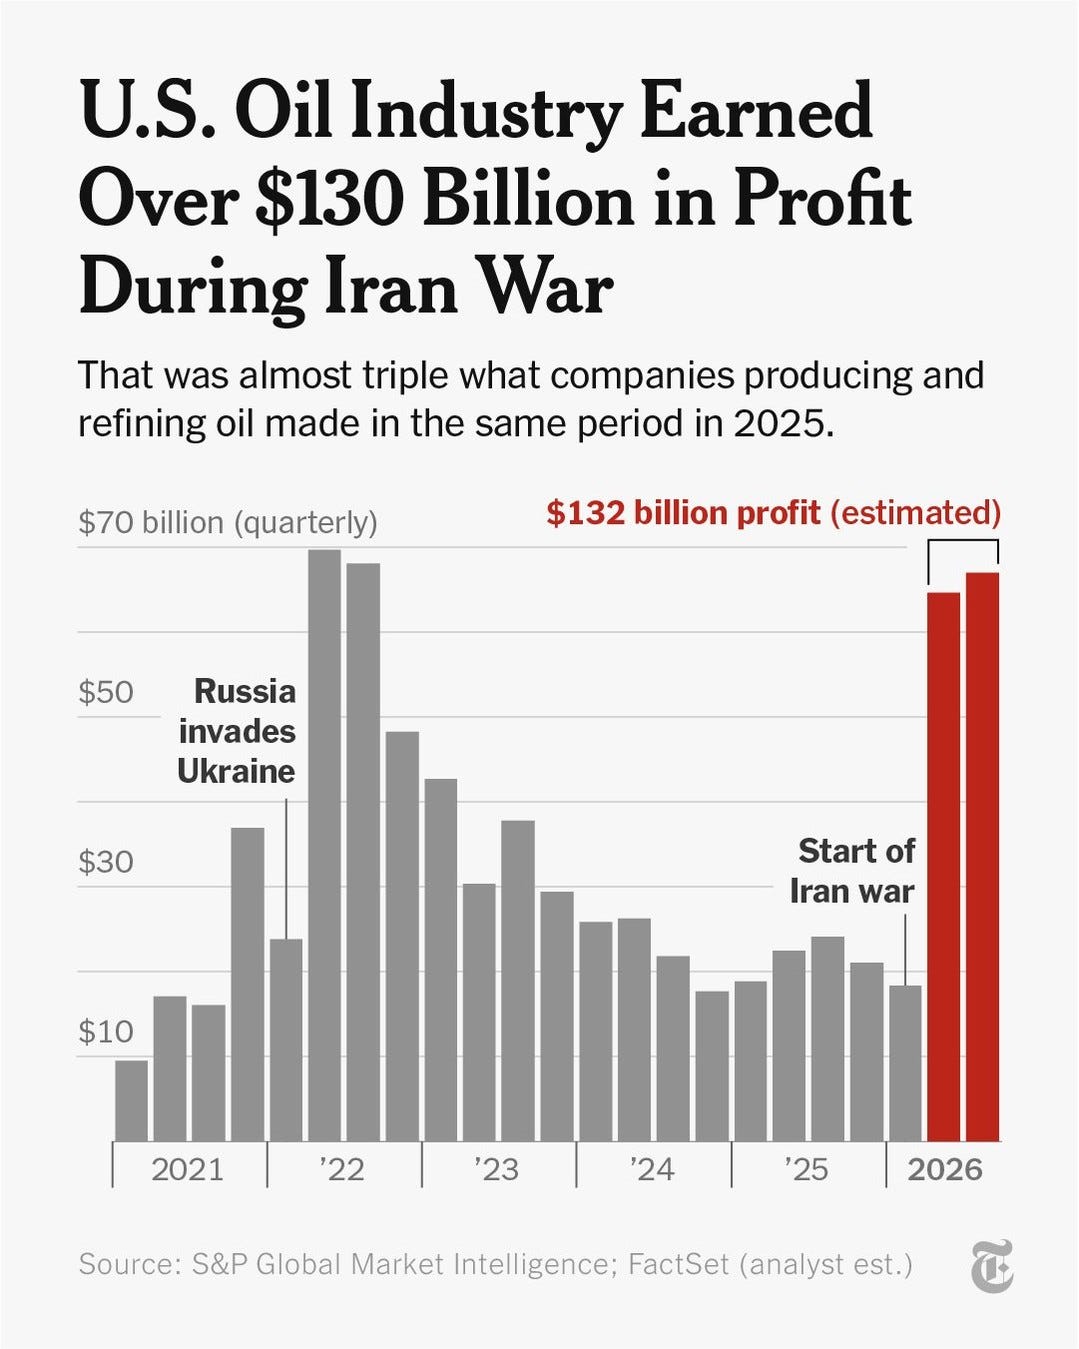
CHART 1 • Fuel bills rise as oil profits soar
Among the biggest beneficiaries from the Iran war were American oil companies, who earned an extraordinary $130 billion in profits. This was despite many Americans being forced to pay much higher prices for gasoline at the pumps and the adverse effects of rising diesel prices on US industry, which have now fed into inflation across the wider US economy.
What’s more, the chart presented here by the New York Times is based on conservative estimates, which it took from the performance of more than 50 large US oil and gas companies from April through to September.
It reports that Americans have spent an extra $147 billion on gasoline and diesel since the war began on 28 February, based on analysis conducted by Brown University’s Climate Solutions Lab. This amounts to more than $1,100 per US household.
What’s really interesting, though, is that after midterm elections, the backlash seems to be focused more on the tech sector and AI providers. There has been very little criticism of America’s oil industry.
Source: The New York Times
Paid subscribers get access to the other four charts: global nuclear electricity, telecom values, European brands and London IPOs. Together, they show how changing denominators, valuation dates and market conditions reshape apparently simple rankings.
