


For $10 a month, or $100 a year, you support a simple mission: spread great data visualisation wherever it comes from. You help fund the work of finding, sourcing and explaining the charts that deserve a wider audience. And you back a publication built on generosity, transparency and the belief that better understanding makes a better world.
CHART 1 • France’s debt-to-GDP ratio rises
I did a data visualisation on 10-year French government bond yields versus the periphery countries during the Eurozone crisis in 2010: Portugal, Ireland, Italy, Greece and Spain. And the conclusion I drew from that was that although it’s certainly true that France’s fiscal credibility has eroded, it is far from distressed territory.
France is still very much a part of the Eurozone core and is a formidable economic power. Despite the recent riots, it’s a country that is still globally economically significant. It has an incredible reputation when it comes to industrial innovation and education. Some of the best business schools in the world are based in France, and it has produced many highly respectable economists.
Having said that, it doesn’t mean that France is not facing problems. However, read this chart carefully because the y-axis is distorted. It should really start from zero because what you’re looking at here is a debt-to-GDP ratio (that can start at zero). Now, although 118% might seem steep, bear in mind that Japan’s ratio soared high above 200%, yet Japan still managed to fix its fiscal issues over the course of a few decades. So yes, the debt pile is growing, but France is not yet experiencing a meltdown.
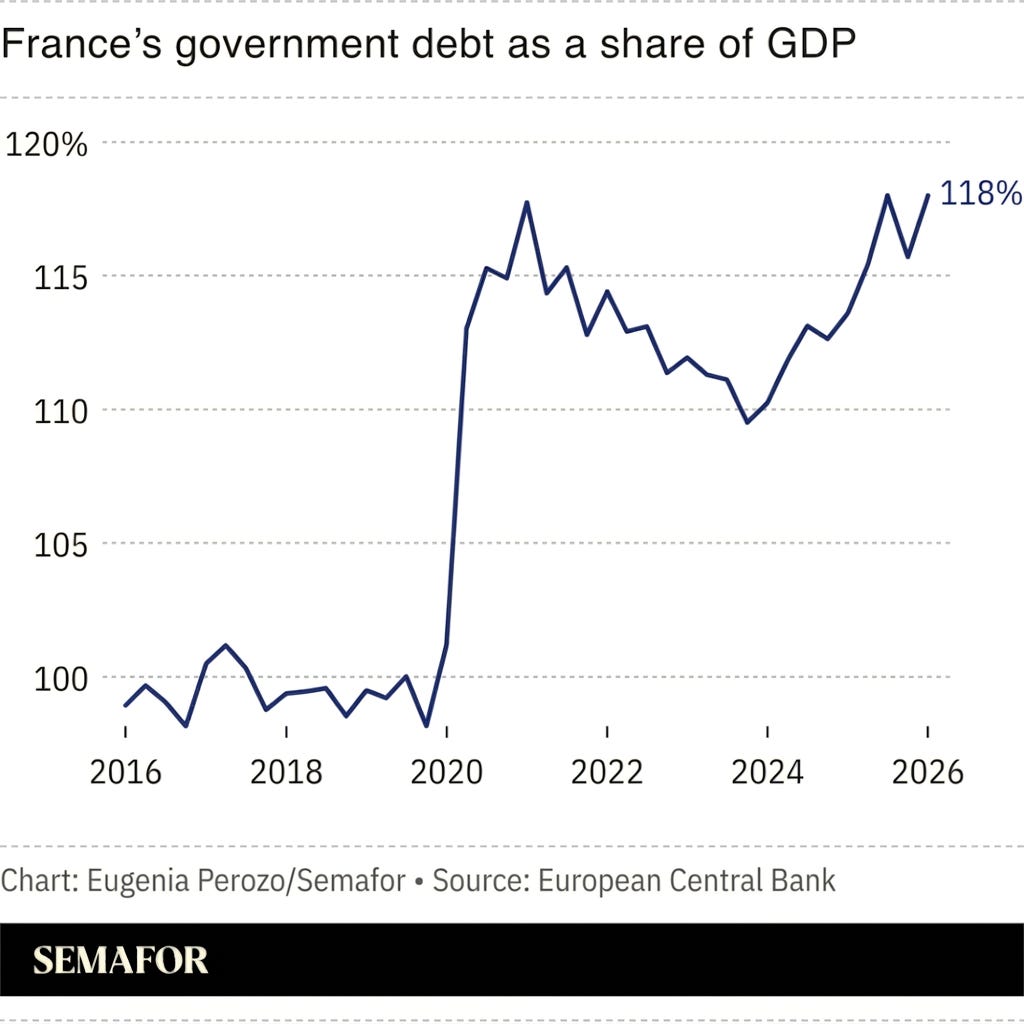
Source: Semafor
Paid subscribers get access to the other four charts: French productivity and spending, Europe’s misery index, British real wages and the widening reach of higher-rate tax. Together, they show why fiscal room and household relief are harder to create than a headline suggests.
