
Five charts to start your day
How the market is pricing in the US election

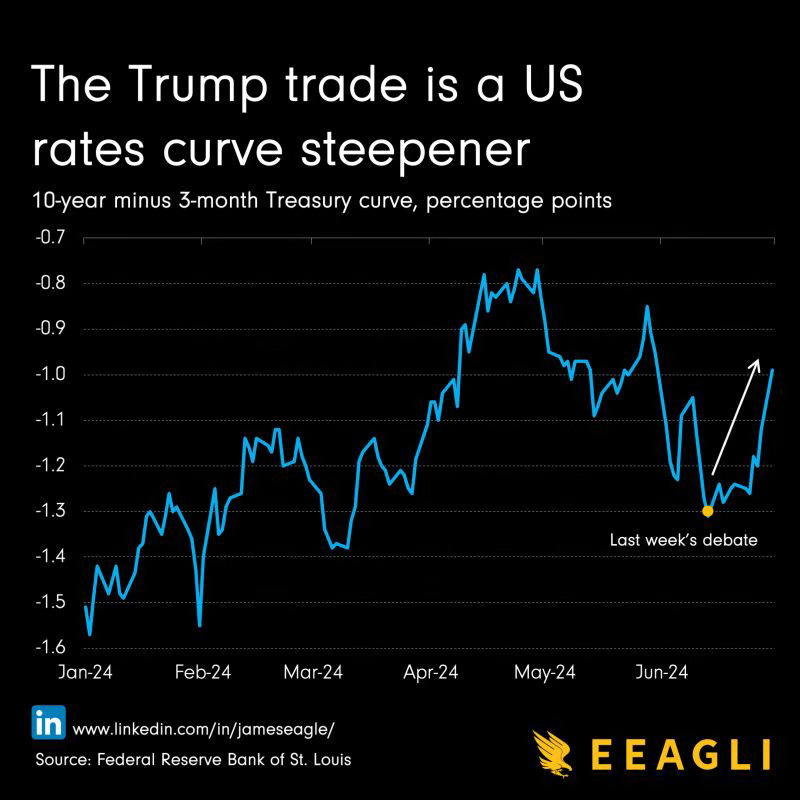
Heard of the Trump trade? It's the market's response to a Trump victory. And the possibility of this happening is being priced in more and more as Biden’s performance wanes in the form of a steepening yield curve.
What you see here in this chart below is the spread between 10-year US Treasuries minus 3-month Treasuries. 10-year yields are increasing due to rising inflationary expectations if there is a Trump administration due to an assumption that there will be greater fiscal spending.
Meanwhile, 3-month short-term rates have stayed anchored by the prospect of a more dovish appointed Federal Reserve chair under Trump. The result is a US rates curve steepener as Trump's election prospects improve.
Will Trump be inflationary. It's difficult to say. The trade war with China that he kicked-off ended decades of deflation that had been imported by the US through cheap manufactured good. Inflation however, is unpredictable and previous inflationary effects may have already been priced in.
What are your thoughts? Are markets overreacting, or is this the start of a new economic paradigm?
Source: Eeagli
Coming up:
Nike latest quarterly income statement visualised
The top 50 stocks versus the rest of the S&P 500
Americans and their passwords: it’s complicated!
Nuclear plants can take nearly a decade to begin operations
If you like the sound of that line up, this is usually a paid newsletter. You basically get all my best ideas daily. Hit the subscribe button if you are interested and this will be sent to your inbox daily.
