
Five charts to start your day
Ireland versus the United Kingdom


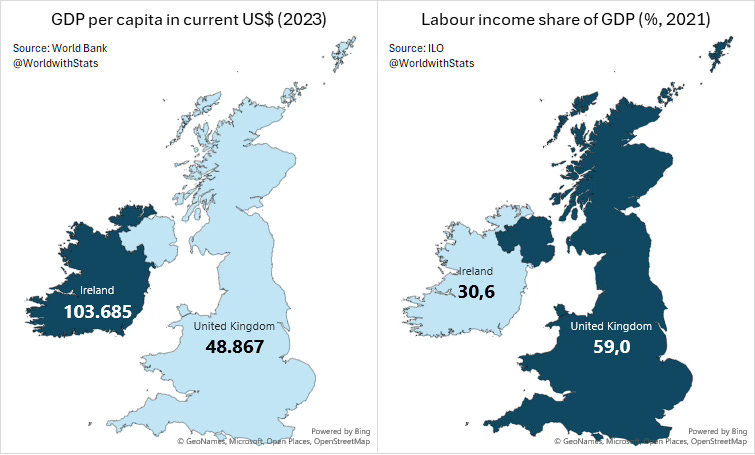
Here’s an interesting chart from World of Statistics. It’s Ireland versus Britain. Ireland, the Celtic Tiger, boasts a GDP per capita that would make Croesus blush: a staggering $103,685, more than double its larger neighbour' the United Kingdom at $48,867.
However, if you dig a little deeper, Ireland’s workers only pocket a mere 30.6 percent of this GDP, while their British counterparts claim a heftier 59 percent slice of a much larger pie.
Ireland's meteoric rise owes much to its role as a corporate tax paradise, luring tech giants and pharma behemoths to its shores.
The result? A GDP figure inflated by accounting gymnastics and profit-shifting, creating a statistical mirage of prosperity. Meanwhile, across the Irish Sea, Brexit-battered Britain grapples with stagnant wages and a cost-of-living crisis. Its more diversified economy has struggled to find its footing in a post-EU world.
The lessons are clear: GDP per capita, that darling of economists, can be a fickle friend. Ireland's dual economy – a thriving multinational sector alongside struggling domestic industries – highlights the perils of chasing headline figures at the expense of balanced growth. For Britain, a higher labour share offers cold comfort amidst broader economic malaise.
Both nations face challenges, but GDP data from the UK seems more grounded in reality.
Source: World with Statistic
Coming up:
Alphabet income statement visualised
Tech has been trading at valuation multiples last seen in 2002
Electric vehicles are piling up at dealerships
Internet speeds across Europe vary wildly
If you like the sound of that line up, this is usually a paid newsletter. You basically get all my best ideas daily. Hit the subscribe button if you are interested and this will be sent to your inbox daily.
