
Five charts to start your day
Overheating is keeping 10-year US Treasury yields elevated


There are many inflationary forces behind the 10-year US Treasury yield, and this first chart illustrates the point well. Take a look. First, let's talk about the term premium. This is the extra yield investors require to compensate them for holding long-term debt. Despite the yield curve inversion, investors have still increased their demand for a higher yield at the long end of the yield curve.
So, what's happening? It suggests that investors believe inflation in the US is likely to persist in the future and might even rise. We could see the global economy reflate if manufacturing picks up and commodity prices increase. This could also happen if geopolitical tensions escalate and drive inflation higher.
Viewing the story from this angle, the other bars make sense. The Federal Reserve is likely to keep rates on hold and may even raise interest rates. Growth, as mentioned, appears to be a contributing factor. And inflation (as we've also mentioned) seems to be contributing to this uptick in yield as well. These four factors – Federal Reserve policy, growth, inflation and term premium – all seem to contribute to the 10-year US Treasury yield and are all intertwined. That’s what is propping up the 10-year US Treasury yield right now.
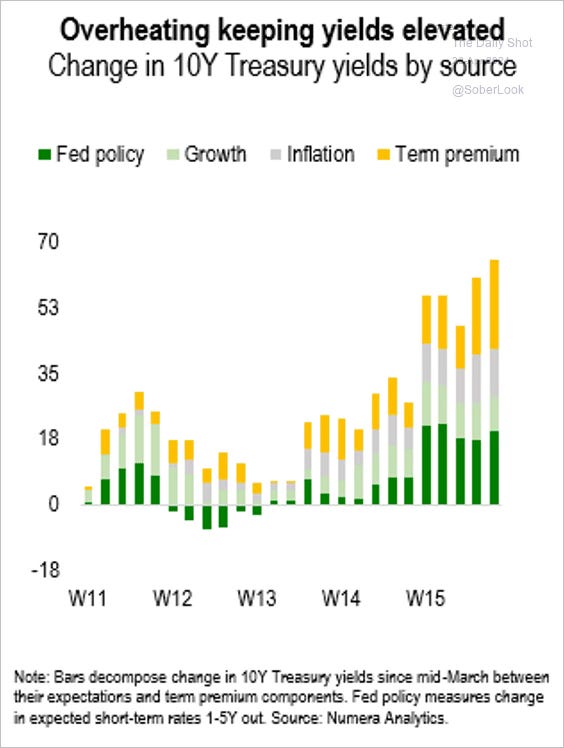
Source: Numera analytics
Coming up:
Dictators often lie about economic growth
Consumer spending has consistently propped up US GDP growth
The eurozone appears to be winning the de-inflation race
Alphabet’s Q1 2024 income statement visualised
If you like the sound of that line up, this is usually a paid newsletter. You basically get all my best ideas daily. Hit the subscribe button if you are interested and this will be sent to your inbox daily.
