
Five charts to start your day
History doesn’t repeat itself, but it sure does chime


History doesn’t repeat itself, but it sure does chime. When I first saw this chart, I was blown away. It was entirely my fault; I hadn’t read the title. Buried in my LinkedIn feed, this cheeky little post from Tavi Costa instantly caught my attention. I smashed that like button, then paused, and laughed.
I’m old enough to remember the dot-com bubble and then watched in horror later as planes slammed into the twin towers. I was off to Bath University to study economics, so these periods of time are not just relevant to me – they’re a piece of my personal history when I first fell in love with market data.
Of course, this time it's different, but not in any sense of denial. Irrational exuberance can occur across different market caps. While the Dotcom bubble was pinned on startups hoping to conquer the nascent e-commerce industry, today's mega-tech is propelled by a narrative that we are entering a new technological super age and these are the new titans of industry.
Take what you want away from this chart. I love it. It made me pause and reflect on this Monday morning.
Performance of the S&P 500 during 1999 and 2000
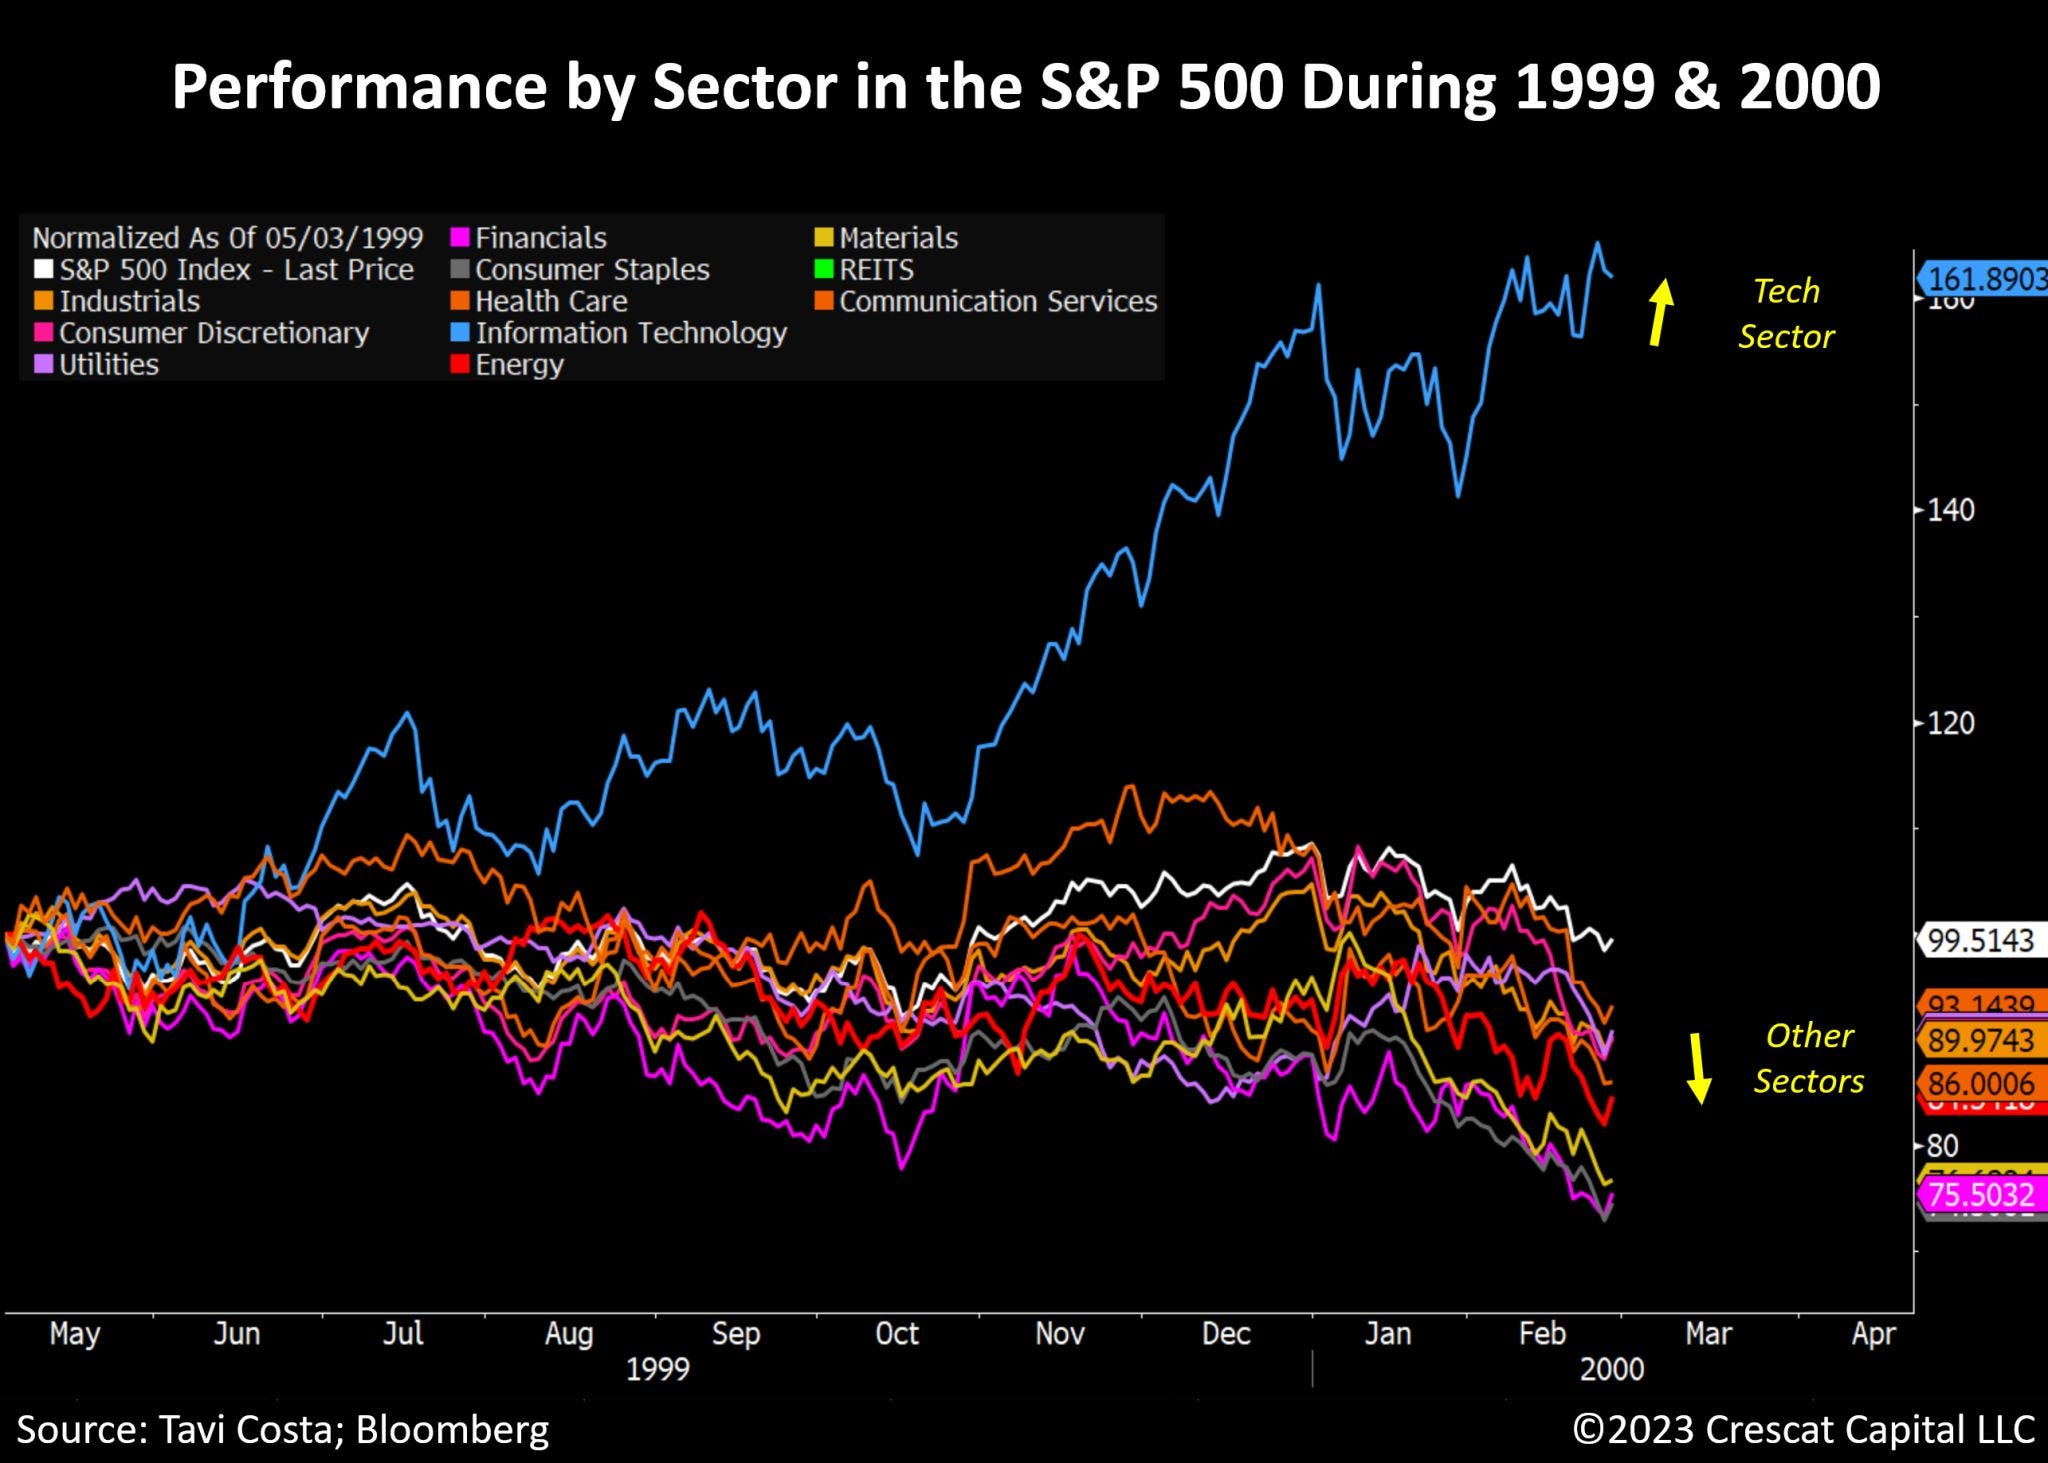
Source: Tavi Costa
Coming up:
Markets expect central banks to start cutting interest rates next year
There has been a 75% crash in the Austrian 100-year bond
The foods with the largest environmental impact
The UK Economy Stalled in the Third Quarter With No Growth in GDP
If you want to view these charts, you will have to become a paid subscriber I’m afraid. But I promise you it is well worth it. I look at hundreds of charts a day and these are my top picks.
