
Five charts to start your day

Have you heard of the magnificent seven? That’s Alphabet (Google), Amazon, Apple, Microsoft, Meta (Facebook), Nvidia and Tesla.
These companies have been the biggest contributors to stock market returns this year. Have a read of this note by S&P Global, written a couple of months back if you are interested.
That’s the theme of the first chart by Robeco – the increasing concentration of returns.
The MSCI World has progressively got more concentrated over the last decade, exposing ETF and index investors to greater concentration risk.
Stock market returns are getting more concentrated
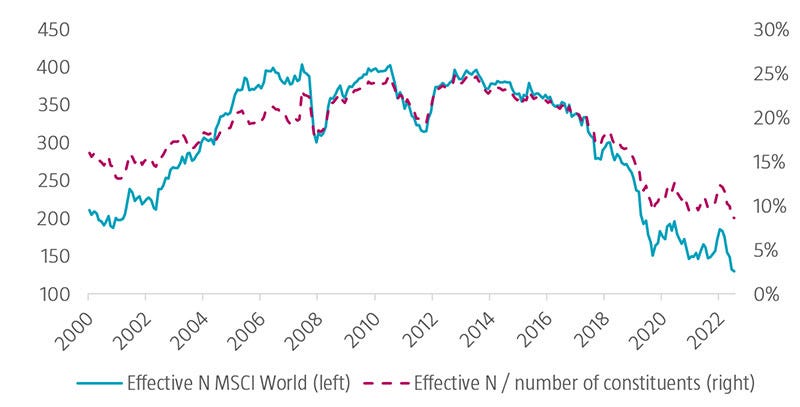
Source: Robeco, https://www.robeco.com/en-int/insights/2023/07/quant-chart-whatever-you-call-it-markets-are-getting-narrower-and-narrower?cmp=so_3_6288
What is “effective N”?

Effective N compares the balance between portfolios with diverse weights and those that are highly skewed. It quantifies the level of diversification in a portfolio, providing a clear measure of its balance.

For example, in a portfolio of 100 stocks with equal weights, the effective N value would be 100, indicating a well-diversified portfolio. Conversely, if a single stock dominates 99.9% of a 100-stock portfolio, the effective N value would be closer to 1, highlighting a highly skewed and imbalanced portfolio.