
Five charts to start your day
Is the party already over for US consumers?

This chart has been doing the rounds on social media, especially last week. What’s the story here. It’s quite simple. As of March 2024, the US economy has now seen the complete depletion of the excess savings that were accumulated during the pandemic period.
If you remember, with the US economy effectively shutdown over night, savings rapidly built up during the Pandemic. Restaurants were closed, holidays cancelled and most forms of leisure activity ceased. People spent a lot more time at home and subsequently, saved a lot of money. These savings were further fuelled by substantial US government support, which helped boost savings more.
At its peak in August 2001, savings grew to $2.1 trillion before steadily declining. Despite the depletion of pandemic-era savings, consumer spending has remained robust, supported by a strong labour market, increased asset holdings and access to credit.
While uncertainties persist regarding the future trajectory of consumer spending, it's unlikely to sharply decline as long as households can sustain their consumption patterns through employment, wealth accumulation and borrowing.
However, as you can see in the charts that follow, headwinds to this factors, might be beginning to emerge.
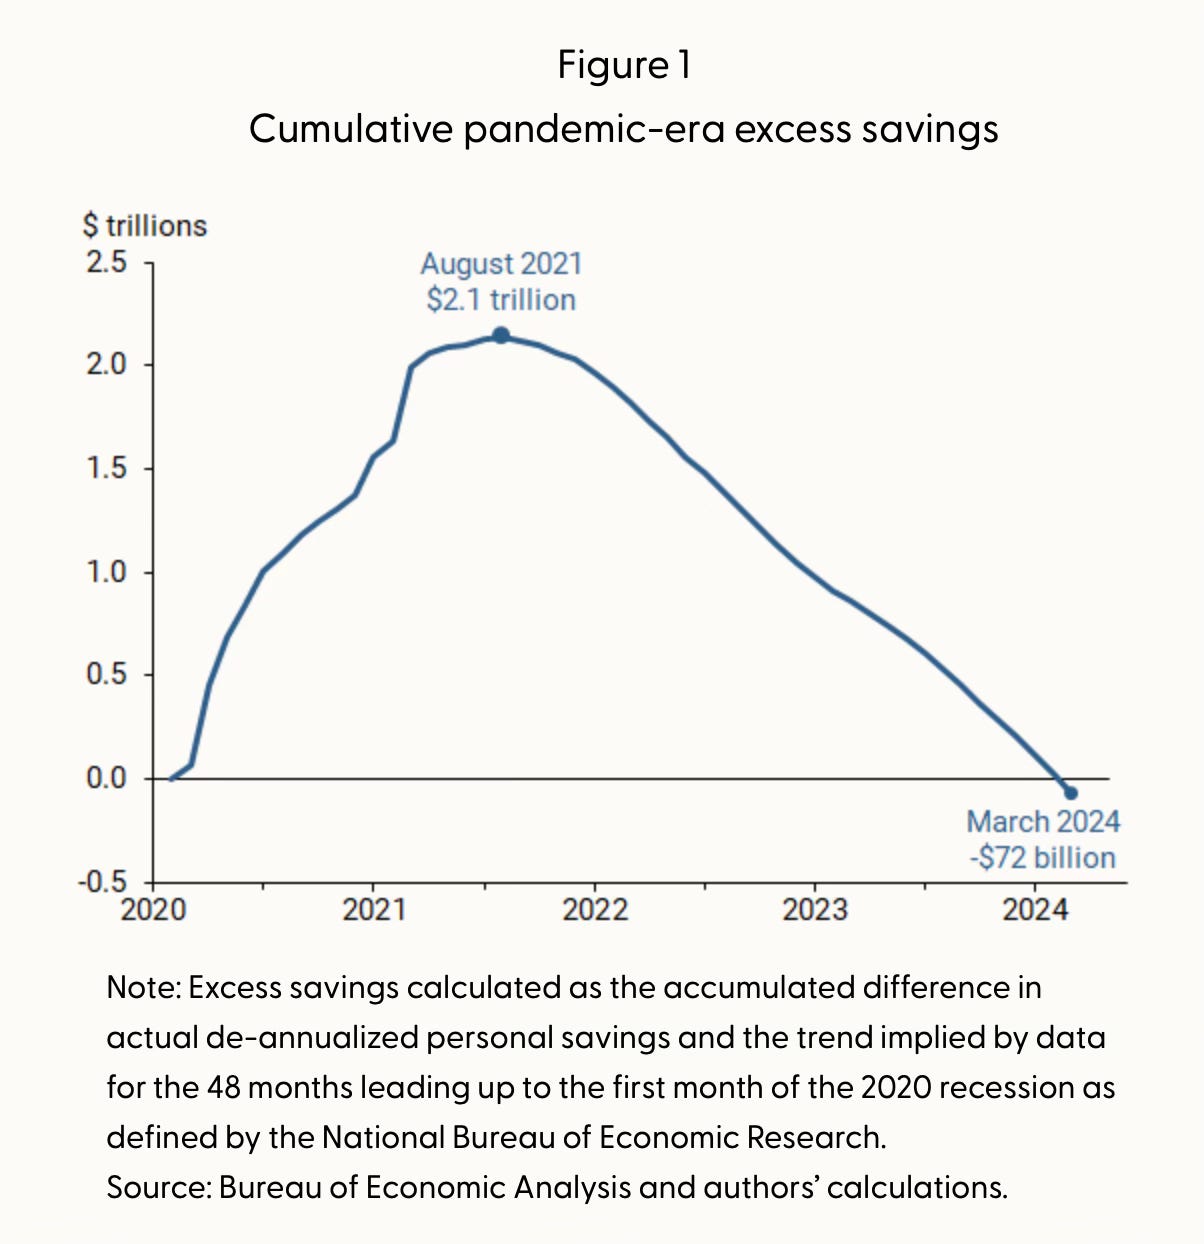
Source: Federal Reserve Bank of San Francisco
Coming:
Could declining consumer credit impact US economic growth?
Germany's growing trade deficit with China
US action has been linked to a drop in flow of sensitive goods to Moscow
Guyana is projected to be the fastest-growing emerging market in the world
If you like the sound of that line up, this is usually a paid newsletter. You basically get all my best ideas daily. Hit the subscribe button if you are interested and this will be sent to your inbox daily.
