
Five charts to start your day
The inequality of carbon emissions

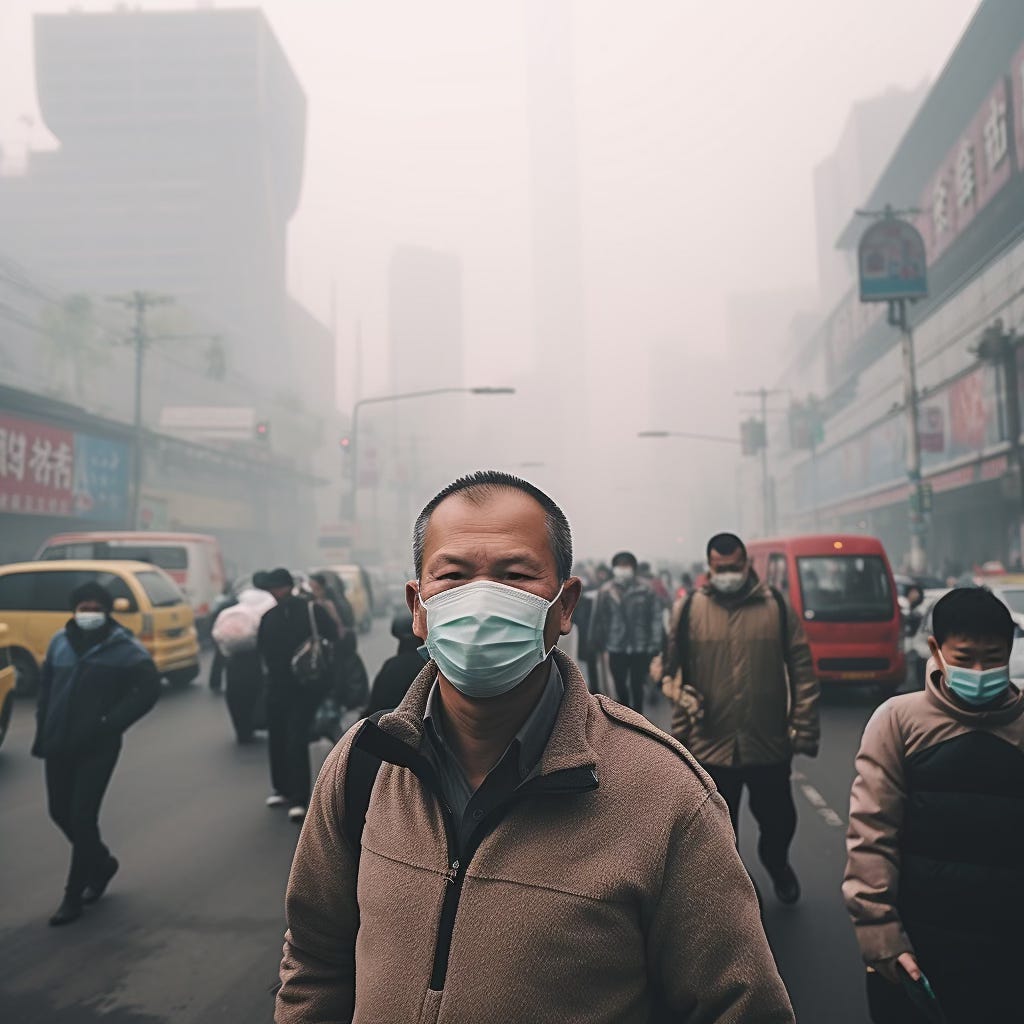
There is a certain inequality about carbon emissions. In the developed world, we've spent centuries burning them to industrialise our economies. We've enjoyed a quality of life that the human species has never before enjoyed. Yet, we now need to decarbonise.
It's easy for us to make pledges to meet net-zero because we now have great infrastructure and the wealth to do it.
But what about emerging markets? They have become our workshops. We import deflation in the form of cheap manufactured goods from them. In return, we export our carbon emissions, through the factories they use to make our stuff. I don't know why but no one really talks about this topic.
Should emerging markets be allowed to develop and enjoy what we have? Or should they decarbonise and stay poor? Take a look at this data visualisation below. It covers the top 15 carbon emitters since 1850.
The inequality of carbon emissions
Source: Eeagli
Coming up:
Limiting global warming to 1.5 degrees by 2050 will be tough
The probability of negative returns falls the longer your time horizon
The world’s 25 richest families have over $2 trillion in wealth
The British public are having regrets about Brexit
If you like what you see here, and you would like to view the other four charts, consider becoming a paid subscriber. It costs less than two cups of coffee for a whole month’s access.
