
Five charts to start your day
Why is gold rallying right now?

Everybody is talking about gold right now. It's the commodity that has attracted so much attention recently.
Why is gold rallying right now?
There are several factors. Firstly, real interest rates, which greatly influence gold prices, have seen a decline, making gold more attractive. Secondly, a weaker US dollar has enhanced the purchasing power for non-US gold buyers. Additionally, geopolitical risks, such as the Israel-Gaza conflict, have historically driven gold prices up.
Finally, a structural change in central bank demand for gold, particularly with countries diversifying away from US dollar assets, has also contributed to the increase in gold prices. That’s what the second chart is about.
But before we get to the second chart, let's start with the first one. I found this particularly interesting. It compares the purchasing power of a dollar, versus gold, since 1971. The chart isn't labelled very well, but the story is interesting.
The purchasing power of gold versus the US dollar
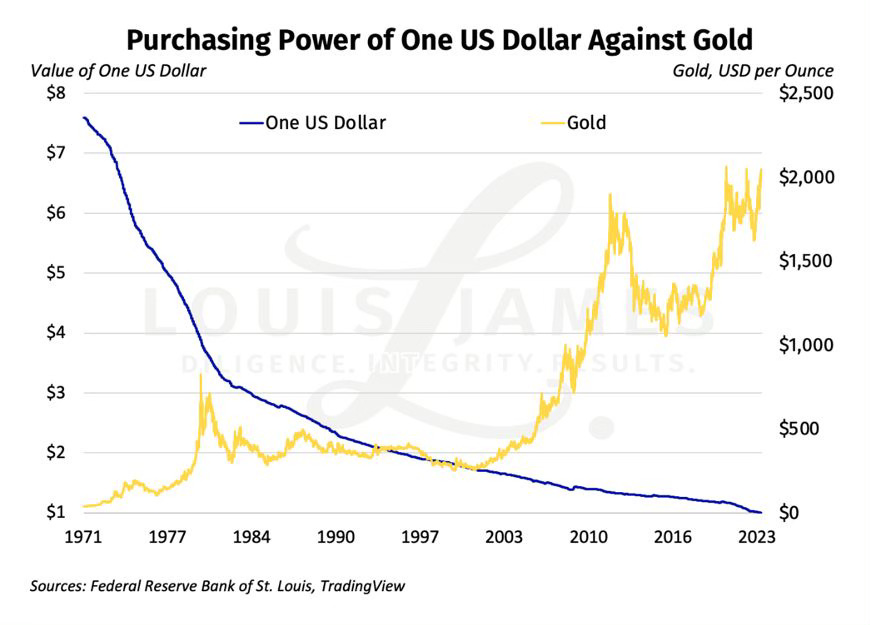
What they seem to have done is calculated the real value (inflation adjusted) of a US dollar in 1971 based on its value today. As you can see it has fallen from about $7.50 at today’s purchasing power that $1 gives you. Gold meanwhile, has been added in on the second axis, using the typical futures price – the US dollar per troy ounce.
Coming up:
Central banks are on pace to buy another 1,000 tonnes of gold in 2023
The largest US banks in terms of assets
Visualising portfolio return expectations by country
Yields have fallen across fixed income asset classes
If you like what you see here, and you would like to view the other four charts, consider becoming a paid subscriber. It costs less than two cups of coffee for a whole month’s access.
