
Five charts to start your day
The US in not getting as much for each dollar borrowed


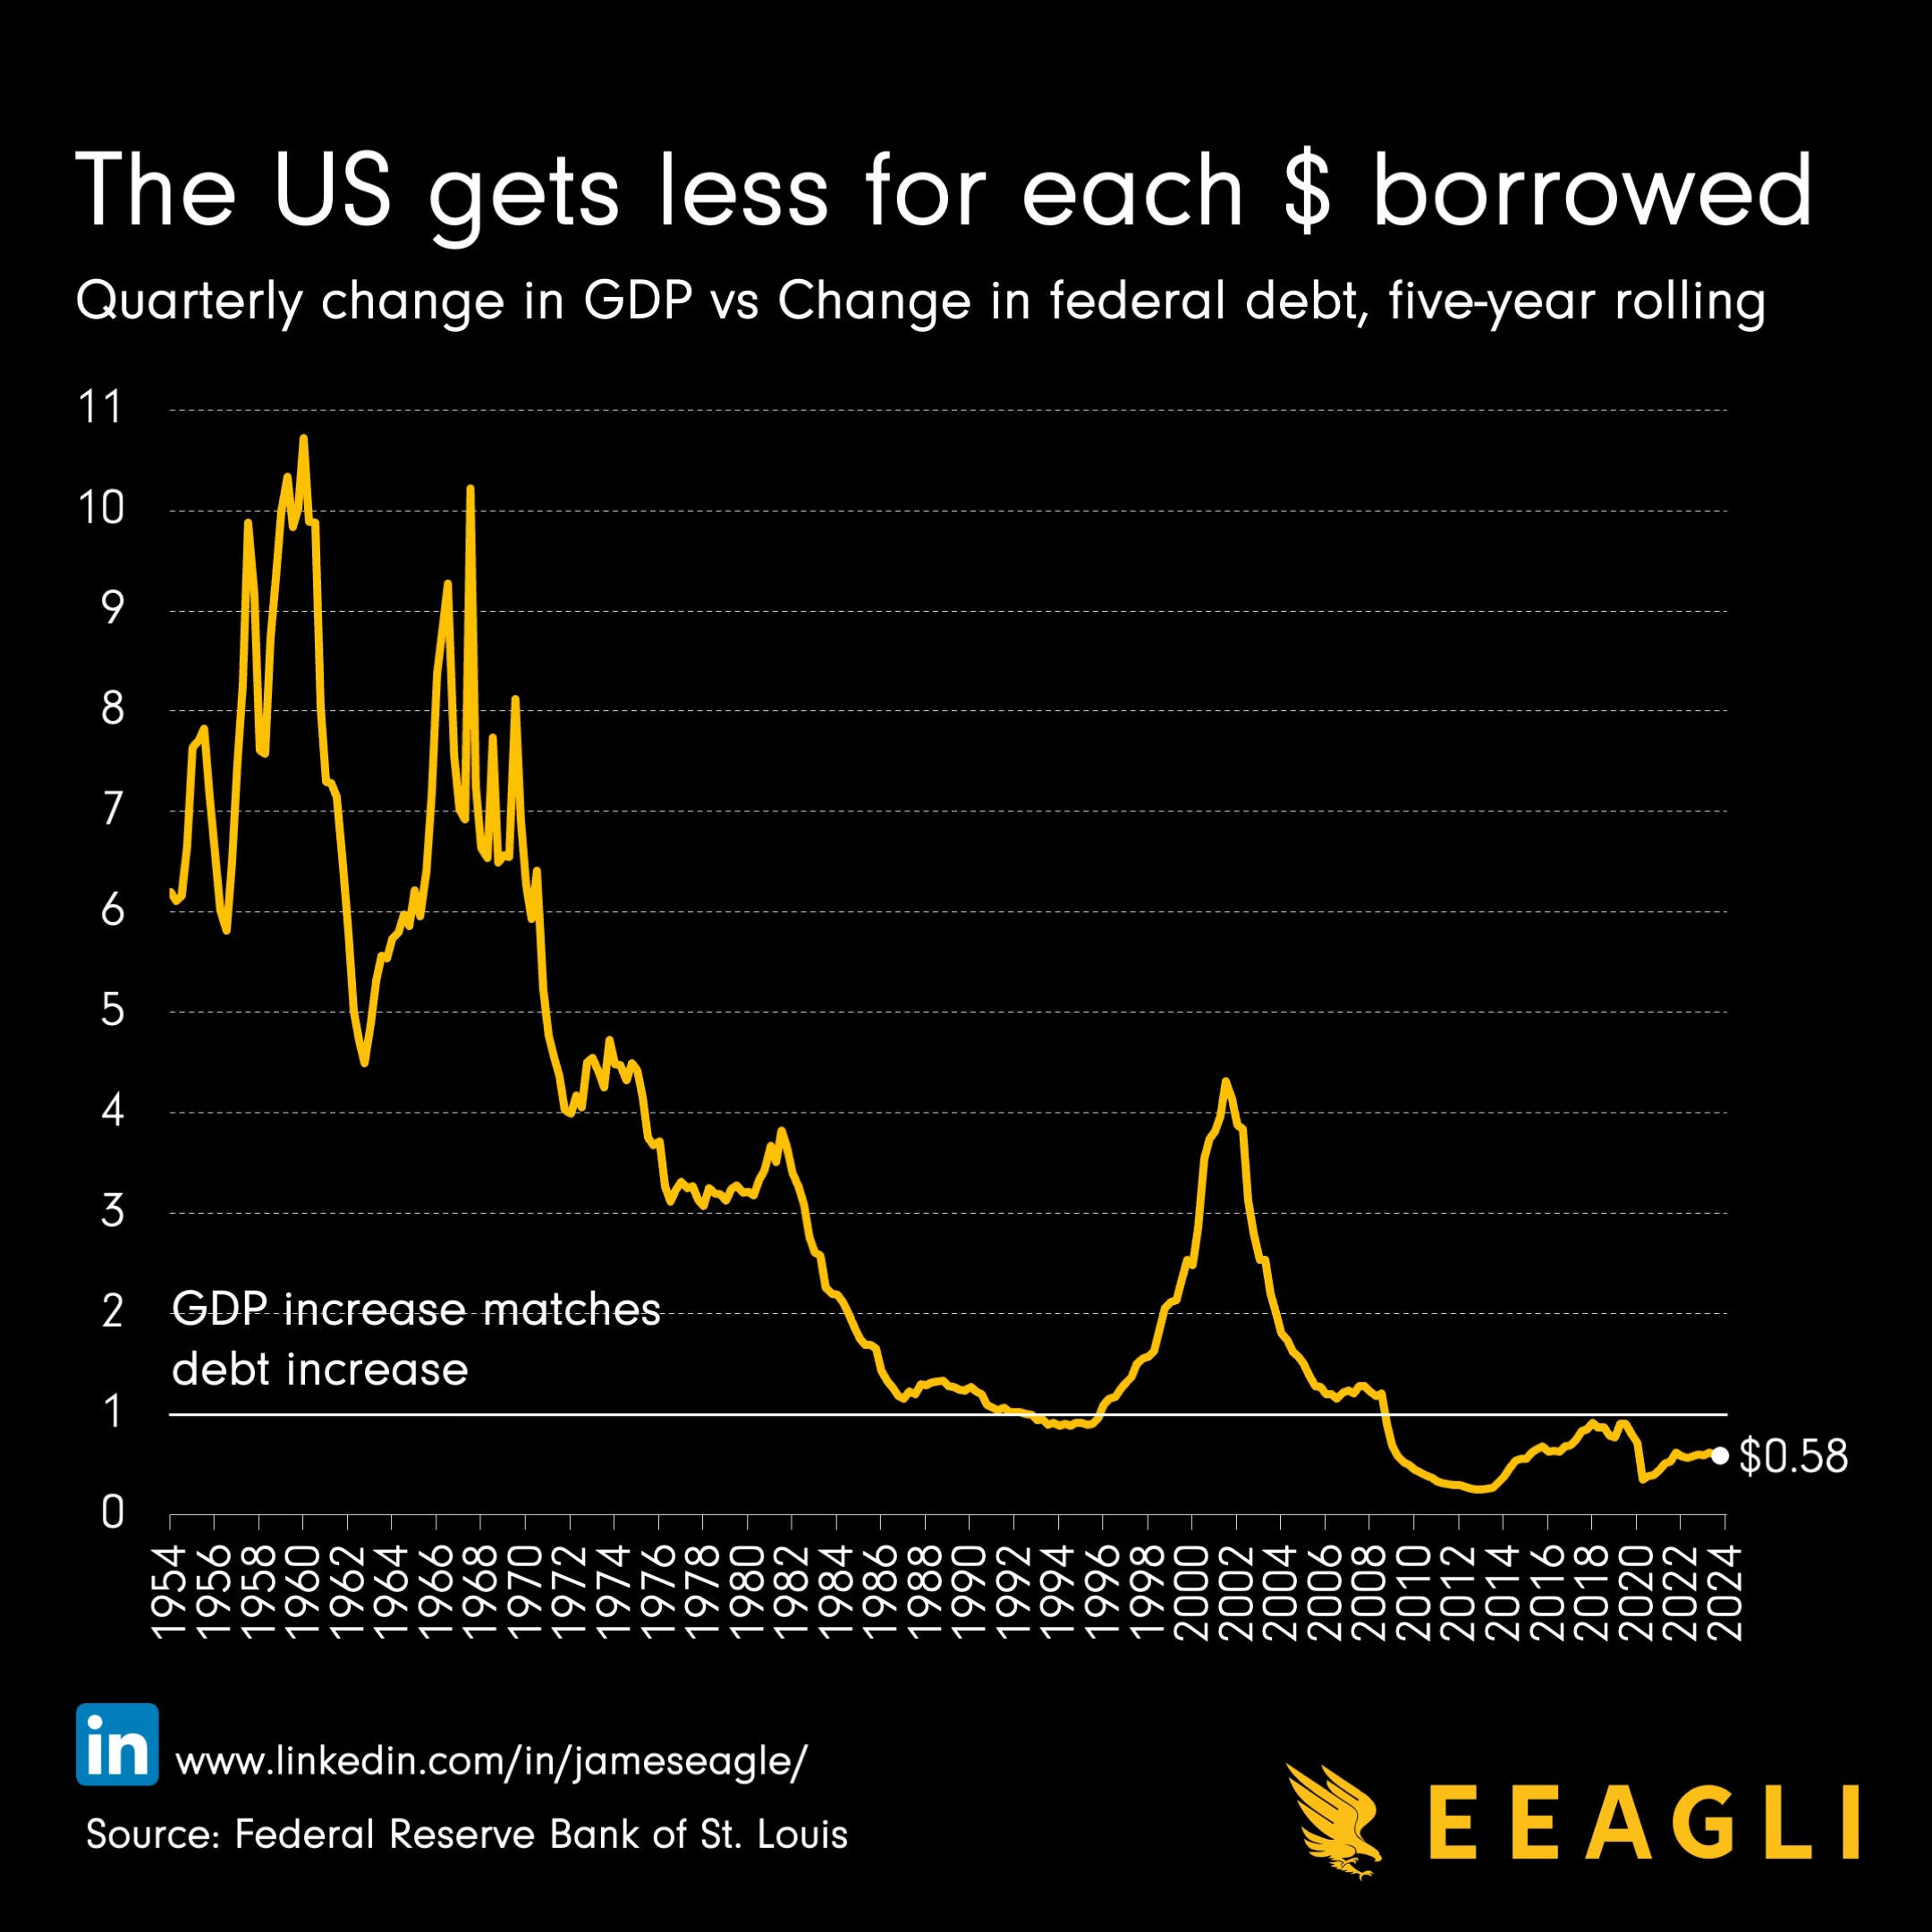
On my LinkedIn feed last week, there was a chart pinned to the bulletin board that told a sober tale. It was an unassuming graph from Bank of America Global Research. I ran the data myself and recreated it.
It depicts a six-decade journey of the American economy, but unlike the upward trajectories that are often posted, this one slopes downward and dramatically so.
There is an unsettling message behind it: the bang for each borrowed buck is dwindling and fast. It is a clear visual representation of America's fiscal challenge. The borrowed dollar is not as potent as before.
The diminishing returns on national debt should be cause for concern. Once a potent catalyst for growth, with each borrowed dollar in the 1960s generating over $6 in GDP, US debt's efficacy has waned dramatically. Today, that same dollar yields a mere $0.58 in economic expansion. Surely this questions the sustainability of the US fiscal trajectory.
The country has accumulated debt at a breakneck pace – roughly $1 trillion every 100 days – the burden of interest payments looms large, threatening to eclipse even defence spending. The roots of this predicament are multifaceted, stemming from decades of expansive government programmes, military expenditures and broader economic headwinds like sluggish productivity growth.
Somehow the US government will need to create a path that enhances productivity and leverages debt more judiciously. If it fails, the country might find itself trapped in a cycle of borrowing with ever-diminishing returns.
Source: Eeagli
Coming up:
Americans are ditching saving accounts for money market funds
European stocks at near record discount to the US
The average price of a used Tesla has plummeted
Blended whisky sales still outstrip single malts
If you like the sound of that line up, this is usually a paid newsletter. You basically get all my best ideas daily. Hit the subscribe button if you are interested and this will be sent to your inbox daily.
