
Five chart to start your day
Inflation is a topic that still persists


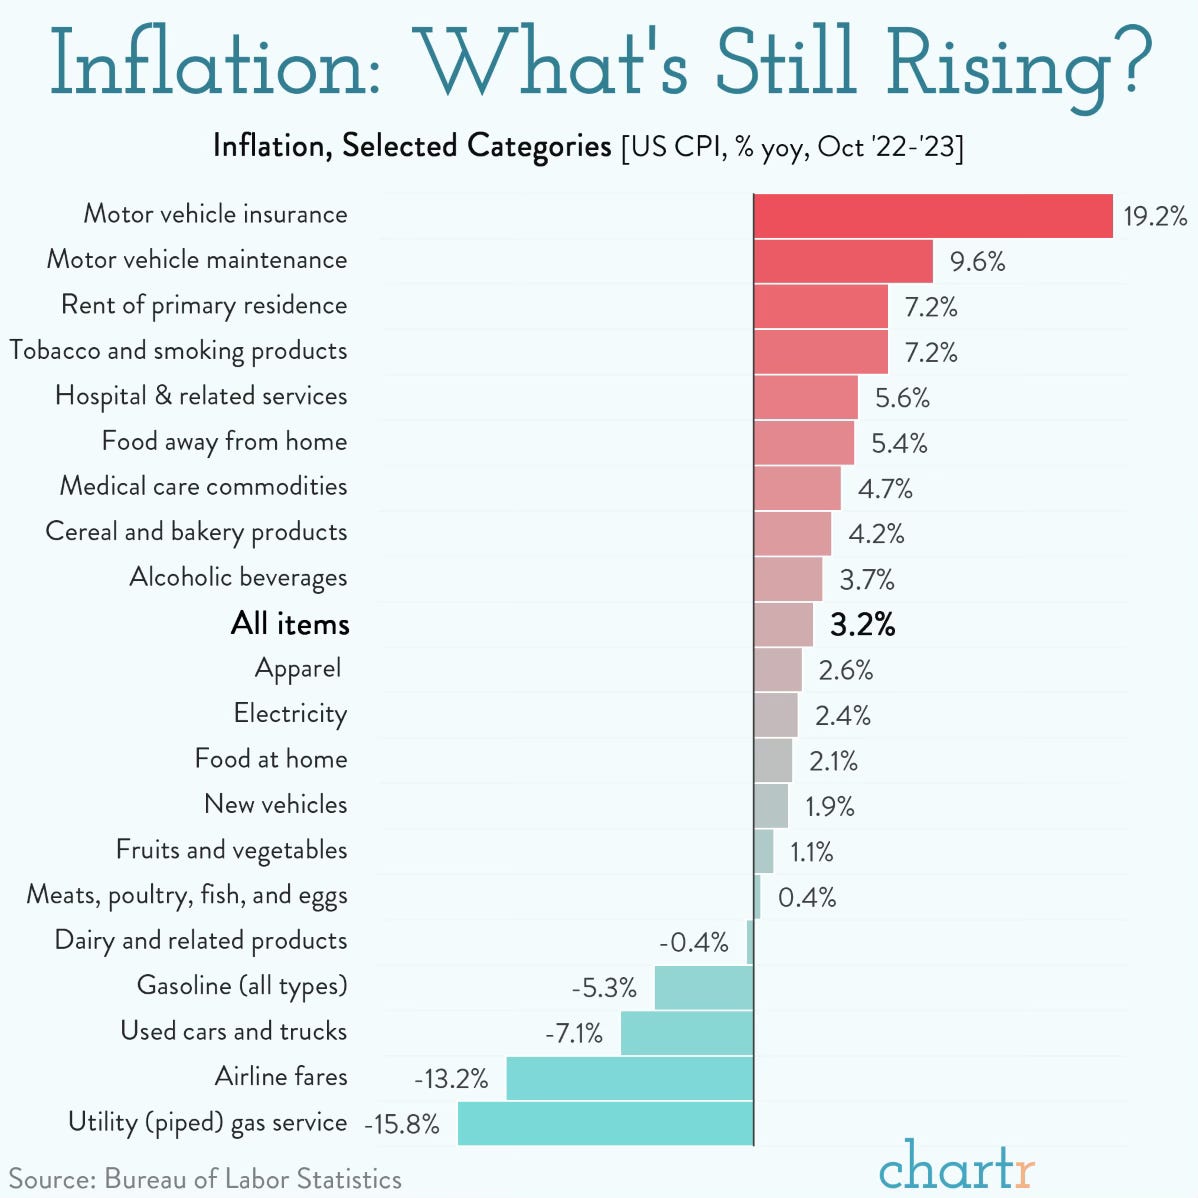
Last week's drop in inflation, with the headline rate falling to 3.2%, was positively received by the markets. This led to a notable decrease in short-term Treasury yields and a boost in stock prices, aligning with the market's anticipation that interest rates had reached their peak.
However, caution remains. Federal Reserve Chair Jay Powell emphasised that the Fed won't be swayed by short-term data improvements, and Richmond Fed President Thomas Barkin noted that, despite genuine progress, the journey to the 2% inflation target might not be straightforward.
Nevertheless, Inflation is the talk of the market. The first chart adds context to what the latest optimistic inflation figures truly indicate.
The decrease in inflation last month was primarily due to lower energy prices, as seen in reduced costs for gasoline, air travel, and natural gas heating. Food prices also played a role. These cost-push inflation factors like energy and food are typically temporary.
They can quickly influence the overall inflation rate, both entering and exiting the calculation. Therefore, we haven't completely resolved the inflation issue yet.
Source: chartr
The second chart we have does the same, but adds a bit more depth to the chart above. It's a heatmap of year-on-year inflation for housing, food, apparel, transport, medical care, recreation, and education. Moreover, this heatmap stretches back over a year, to give you a picture of where inflation is declining. As you can see, US inflation is overall declining across the board, which is a positive sign.
