
Extreme wealth is concentrating even faster
Five charts to start your day


For $10 a month, or $100 a year, you support a simple mission: spread great data visualisation wherever it comes from. You help fund the work of finding, sourcing and explaining the charts that deserve a wider audience. And you back a publication built on generosity, transparency and the belief that better understanding makes a better world.
The world feels richer than ever and somehow most of us feel poorer. That tension runs through all five of these charts.
At the very top, wealth is compounding at a speed that defies intuition, driven by ownership of platforms and networks rather than labour or traditional enterprise. Further down the distribution, capital is being positioned carefully, not withdrawn, but directed towards control, flexibility and assets that can navigate uncertainty rather than ride a rising tide.
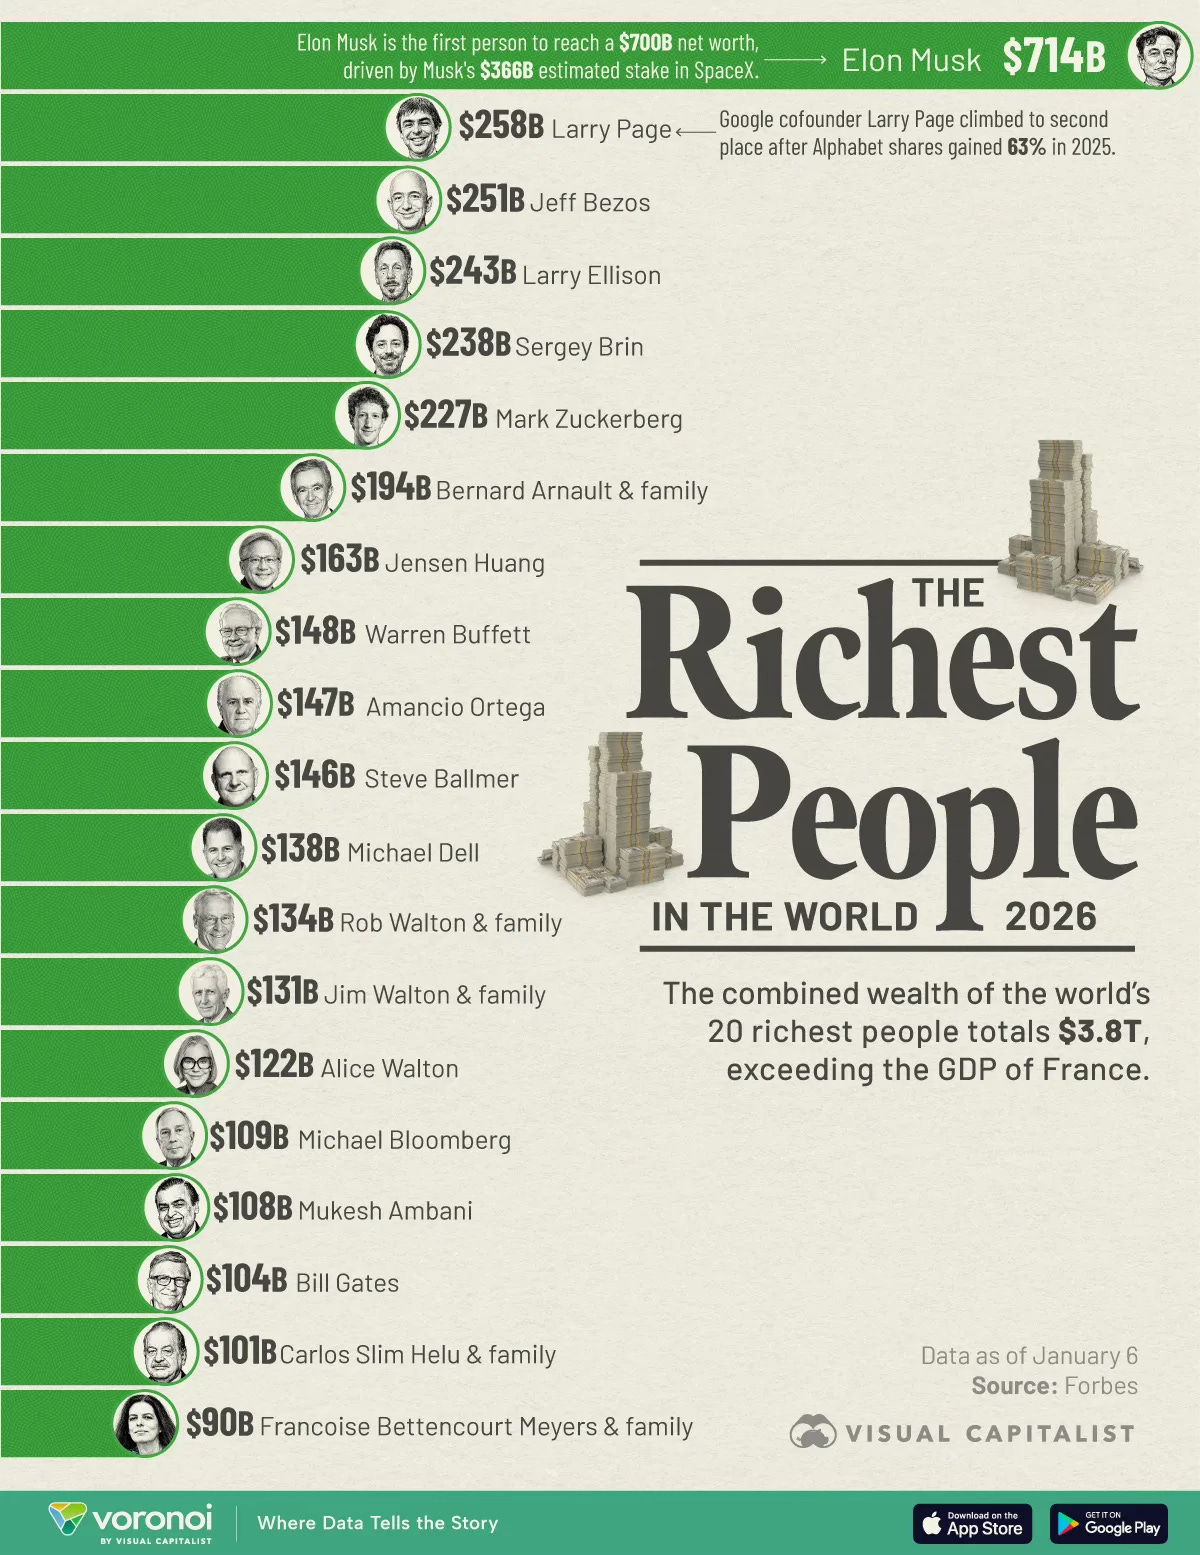
CHART 1 • Extreme wealth is concentrating even faster
The scale of wealth at the very top is now difficult to contextualise. This chart tries anyway.
The combined net worth of the world’s richest individuals exceeds the GDP of major developed economies. One person alone – Elon Mush – has crossed the $700 billion dollar mark, driven largely by equity stakes rather than cash. He could become the world’s first trillionaire this year (well at least paper).
What matters is not the ranking but the mechanism. Wealth is increasingly tied to ownership of scalable platforms, intellectual property and networks that compound faster than wages or traditional businesses.
Markets reward concentration. Capital flows to winners, and winners gain more leverage over capital. This feedback loop is powerful and difficult to interrupt.
The debate is no longer about inequality in theory. It is about how economic systems distribute gains in practice.
Source: Visual Capitalist
There is a temptation to treat these signals as noise. A quirky chart here, a cultural oddity there. In reality, they are responses to the same underlying pressures around security, meaning and control. Markets and people adapt long before narratives catch up.
I have four more charts that extend this theme and explore what these patterns might imply for the years ahead. They are for paid subscribers. Consider joining if you want the full edition.
