


For $10 a month, or $100 a year, you support a simple mission: spread great data visualisation wherever it comes from. You help fund the work of finding, sourcing and explaining the charts that deserve a wider audience. And you back a publication built on generosity, transparency and the belief that better understanding makes a better world.
CHART 1 • Europe’s gas storage levels are entering winter at historic lows
At first, when I saw this chart, I found it a little tricky trying to understand what I was looking at. It took me time to digest this graphic from Bloomberg. What it shows is that as of 1 October, the EU gas storage level stood at 72%. This is a record seasonal low. Germany, Italy, France, and the Netherlands account for nearly two-thirds of EU gas storage capacity.
Europe cannot, therefore, afford a severe winter. We are already seeing the cracks starting to appear.
In Poland, the fertiliser industry has called on the energy ministry to take action on energy costs. In Spain, with an election scheduled for 29 November, the country has spent 12 billion euros since March on softening the blow from rising energy bills.
Across Europe, governments, industries and citizens are now in their second major energy crisis in less than five years. Europe has never fully recovered from 2022’s brutal gas price shock that followed Russia’s invasion of Ukraine. European industries were left devastated, feeding fears over continent-wide closures and further deindustrialisation.
With over half of European citizens voting in elections over the next 12 months, there’s a real risk of political shock in at least some EU countries.
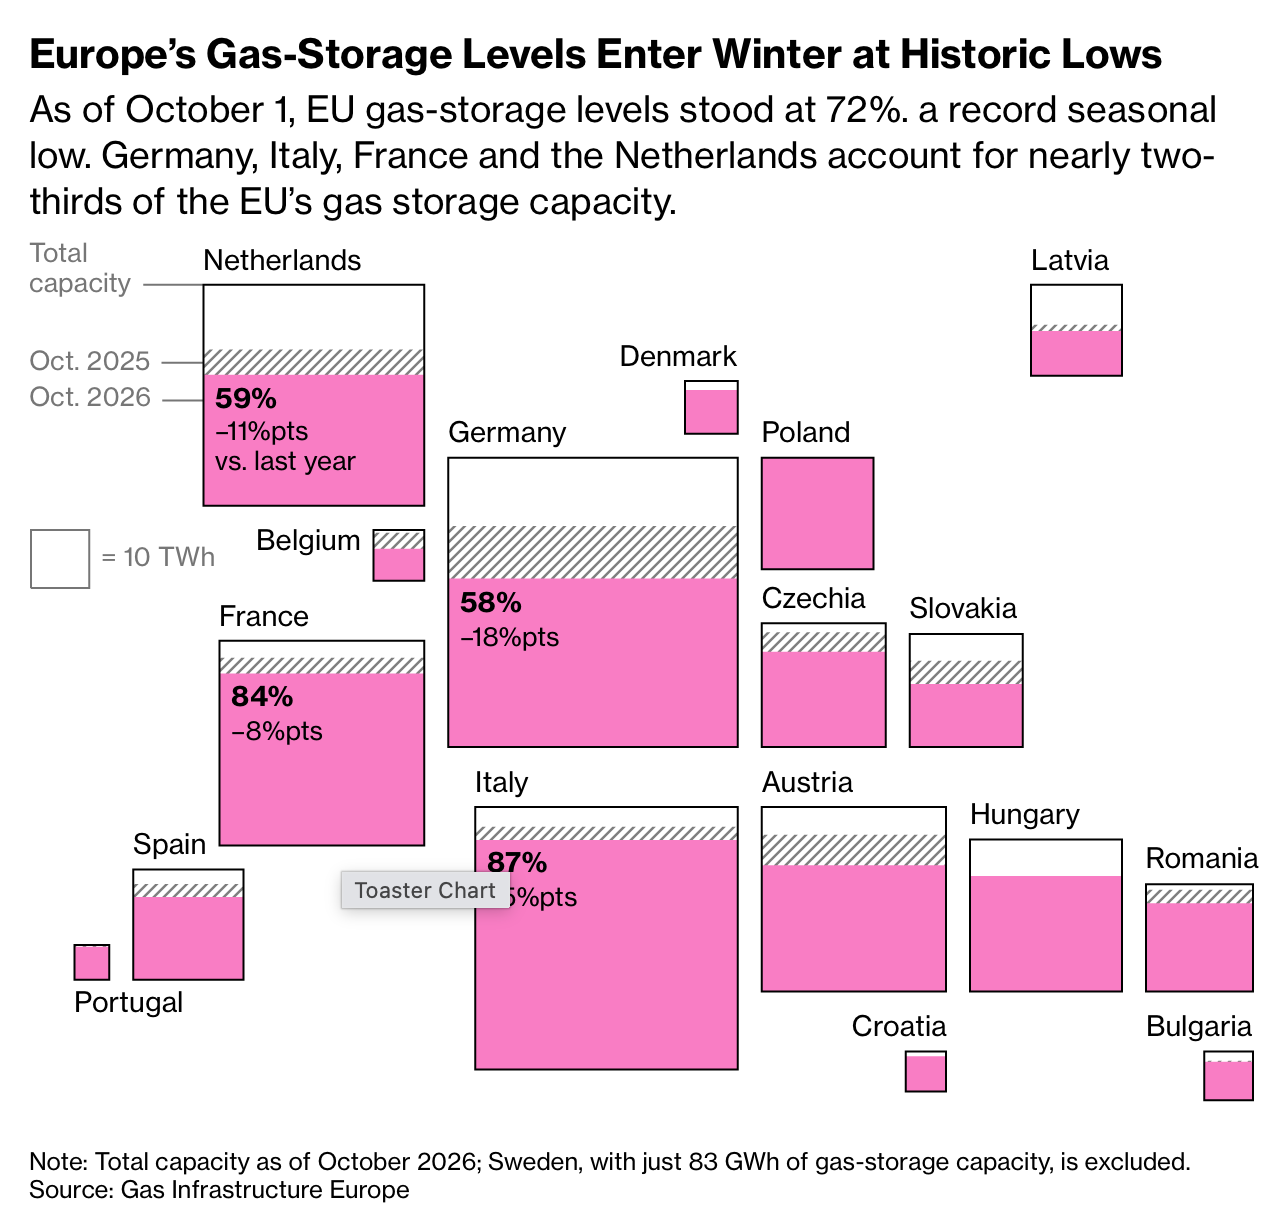
Source: Bloomberg
Paid subscribers get access to the other four charts: US fuel inflation, British mortgage resets, Social Security’s reserves and card balances. Together, they show how rising costs become a cash-flow problem for households and governments.
