

For $10 a month, or $100 a year, you support a simple mission: spread great data visualisation wherever it comes from. You help fund the work of finding, sourcing and explaining the charts that deserve a wider audience. And you back a publication built on generosity, transparency and the belief that better understanding makes a better world.
CHART 1 • Elon spent half a billion dollars on elections
Elon Musk ploughed almost half a billion dollars into the US midterm elections. Some of that money was ploughed into key races ahead of the election, including Republican candidates that he backed, particularly in Texas, where most of his companies are based.
There are rules on how much people, parties and political action committees can actually give directly to candidates, but they don’t necessarily have to give that money directly and instead can spend it supporting those candidates indirectly. More than $9.5 billion was spent in these midterm elections.
So what is the money spent on? It’s used to hire staff to do on-the-ground voter outreach and host events like political rallies. They also spend a lot of money conducting internal polling. However, the majority of the funds are spent on advertising, especially on TV. Traditional broadcast television is the top beneficiary when it comes to this advertising expenditure.
It doesn’t appear to have been good value for money. Texas is now blue.
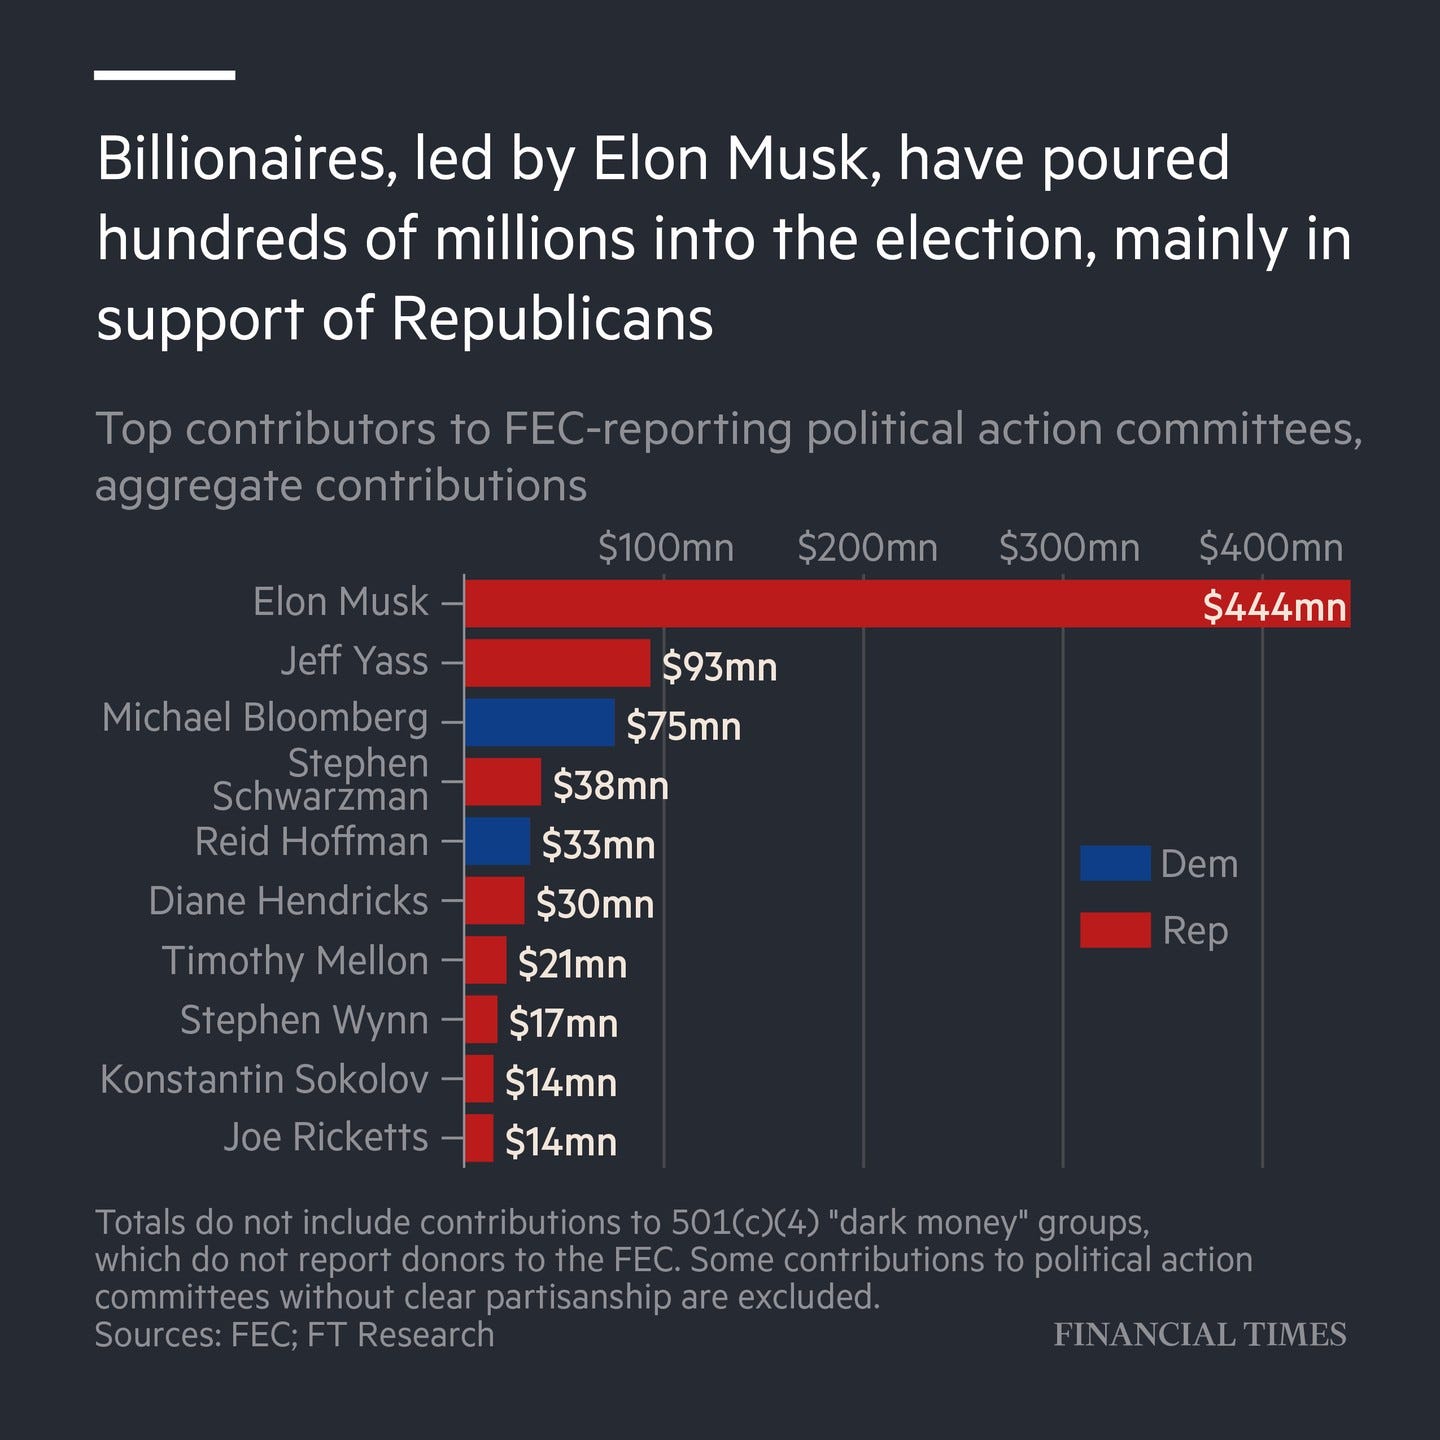
Source: Financial Times
Paid subscribers get access to the other four charts: US wealth gains, Brazil’s election, French protests and military inventories. Together, they show why money, public mobilisation and security claims need different measures.
