


For $10 a month, or $100 a year, you support a simple mission: spread great data visualisation wherever it comes from. You help fund the work of finding, sourcing and explaining the charts that deserve a wider audience. And you back a publication built on generosity, transparency and the belief that better understanding makes a better world.
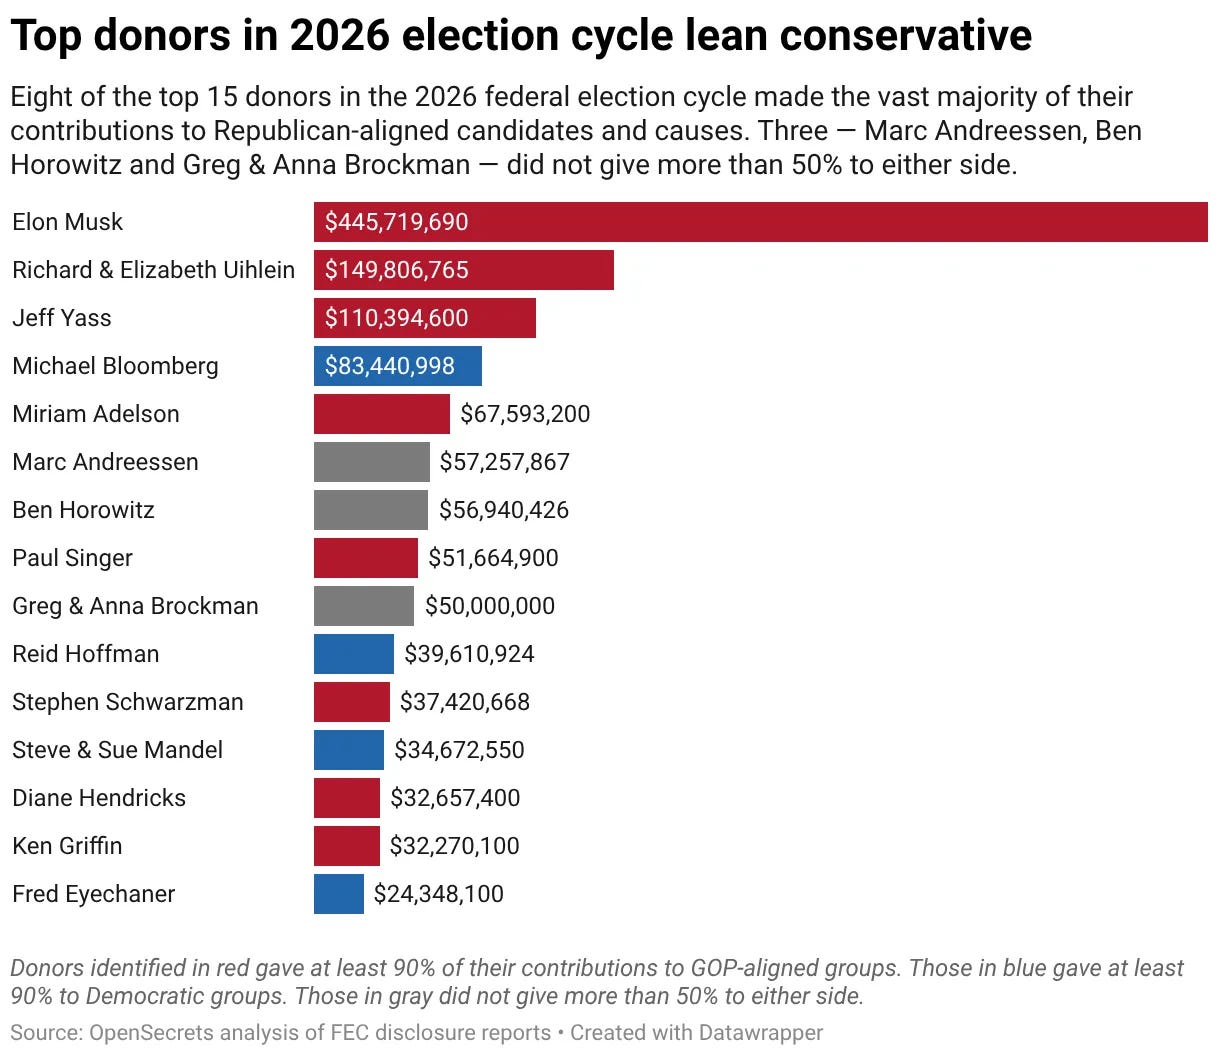
CHART 1 • Elon Musk spends almost half a billion dollars on politics
I’ve seen this chart doing the rounds now for weeks since the end of the midterm elections. And honestly, the only bar that I look at is Elon Musk’s. It is absolutely breathtaking how much money he spent on the 2026 US election cycle.
What’s also really interesting is how these donors end up gifting so much money. A lot of it is not given directly to the party they support. A huge amount of it is actually used to pay for things like television advertising, which is extraordinarily expensive.
In the case of Elon Musk, what’s really interesting is that even though he spent such a vast amount of money, his candidates that he supported lost, especially in Texas. The Republican Party fared so poorly during the midterms that traditional seats that were held by the Republicans were overturned by Democrats.
It shows that money doesn’t buy you an election in the US, which is a testament to the quality of the democratic institutions in the US. America is still a democracy, and that’s the takeaway I get from this chart.
Source: Paul Krugman
Paid subscribers get access to the other four charts: the Democratic House swing, moderate candidates, Trump’s approval and tariff refunds. Together, they show how an election changes both political incentives and the policies voters live with.
