

For $10 a month, or $100 a year, you support a simple mission: spread great data visualisation wherever it comes from. You help fund the work of finding, sourcing and explaining the charts that deserve a wider audience. And you back a publication built on generosity, transparency and the belief that better understanding makes a better world.
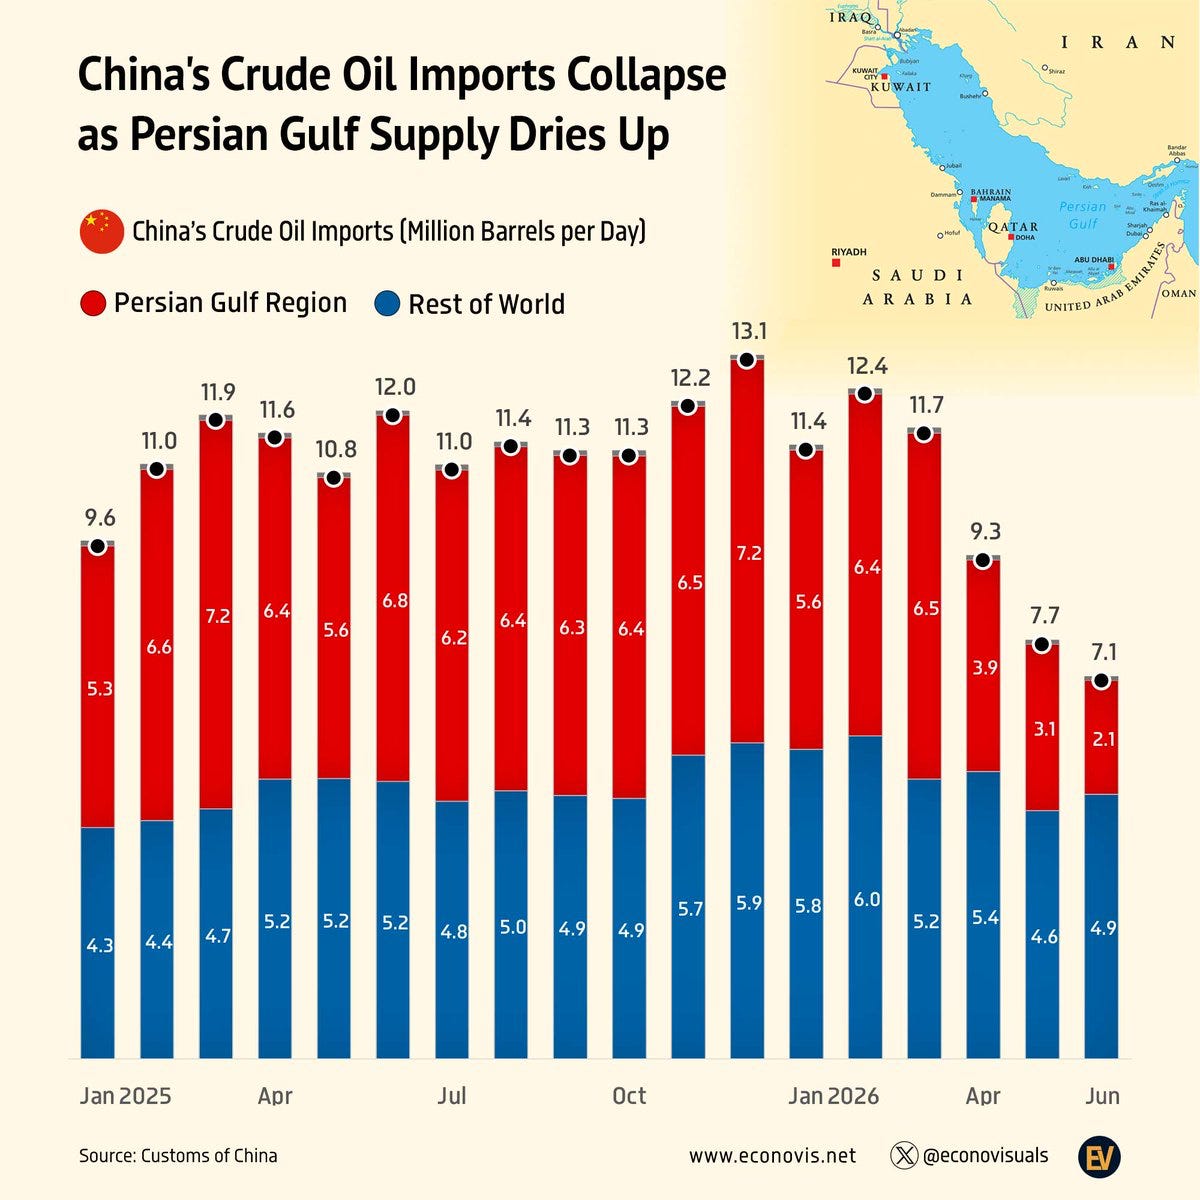
CHART 1 • China’s oil imports from the Persian Gulf collapse
When the US and Israel launched their war on Iran, causing the shutdown of the Strait of Hormuz, oil traders were expecting a brutal global price shock. Although that price shock happened, it wasn’t as bad as it could have been because of China. As the world’s biggest crude buyer, it actually cut imports so hard during this period that fewer barrels needed to be found elsewhere.
Let’s take a look at the data. In June, imports fell 41.3% from a year earlier to 7.12 million barrels a day, the lowest since October 2016. The Gulf portion of this visual dropped from 6.4 million barrels a day in February to 2.1 million in June.
During this period, Beijing drew on its domestic oil stocks and restricted fuel exports. Coal, renewables and electric vehicles helped the economy function with less imported oil. Less Chinese demand for oil actually helped contain prices. This is not a narrative commonly mentioned in the press, but this particular visual tells the story very well. China was obviously protecting its own interests, but it ended up also helping the global oil market.
Source: Econovisuals
Today’s newsletter is all about energy. Producing enough is only part of the challenge. A country that depends on imported oil or gas remains vulnerable to wars, price shocks and disrupted trade routes. Renewables can provide greater control by generating power at home, but they bring different risks, including unreliable weather, weak grids and limited storage. Energy risk never really disappears. It simply moves from oilfields, pipelines and shipping routes to electricity networks, batteries and the weather.
Paid subscribers get access to the other four charts: America’s shift away from OPEC crude, the US production lead, Europe’s electricity mix and the lives saved by air conditioning. Sign up to read the full edition.
