


For $10 a month, or $100 a year, you support a simple mission: spread great data visualisation wherever it comes from. You help fund the work of finding, sourcing and explaining the charts that deserve a wider audience. And you back a publication built on generosity, transparency and the belief that better understanding makes a better world.
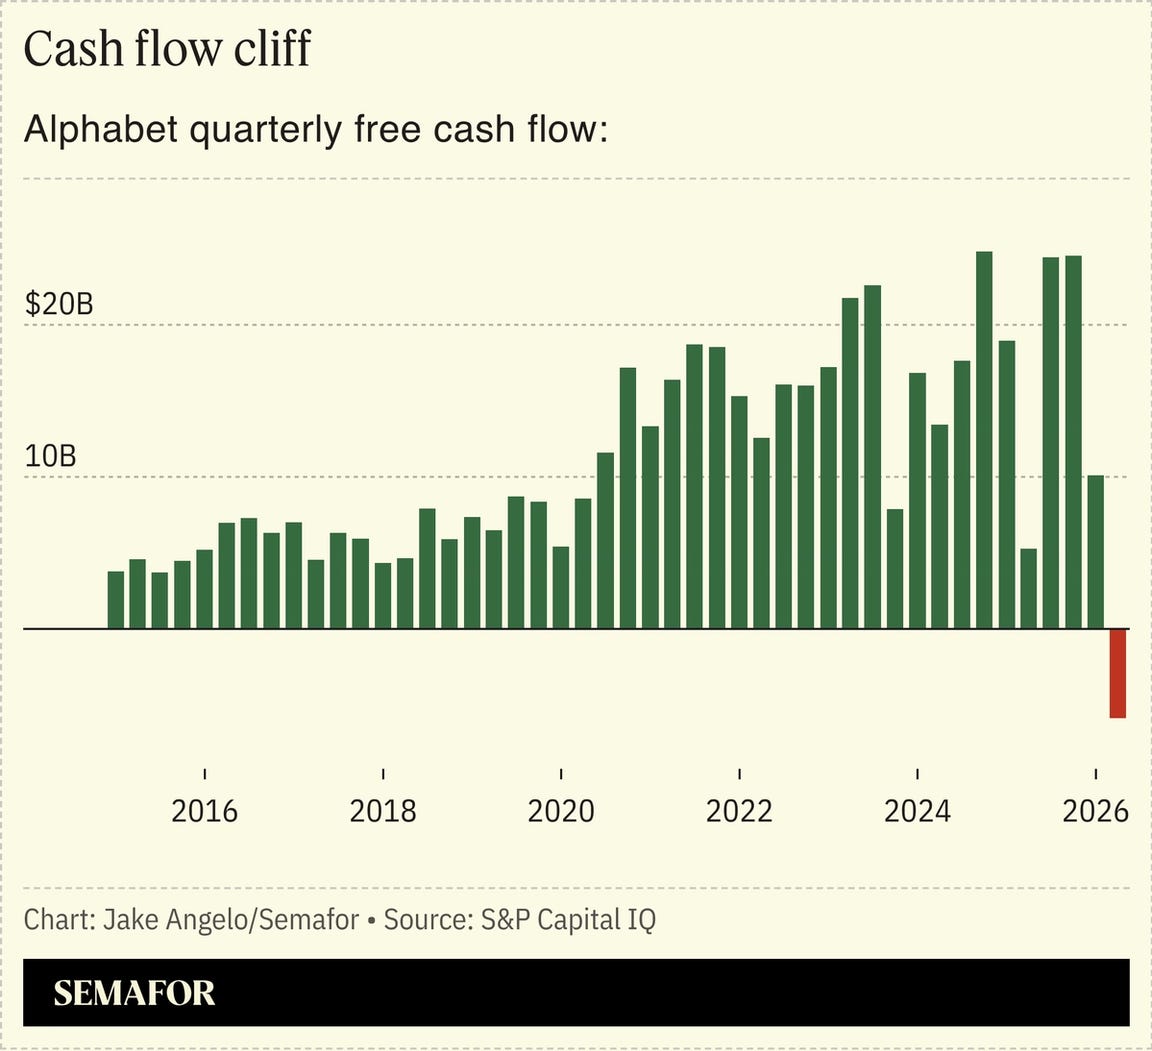
CHART 1 • Google’s free cash flow has turned negative
Free cash flow is the cash left over after a company has paid its running costs and capital spending. Alphabet is the parent company of Google, and it is very profitable. However, AI spending has become so large within the company that it has pushed quarterly free cash flow below zero.
Take a look at this chart from Semafor. During the second quarter of 2026, Alphabet reported minus $5.9 billion in free cash flow. This happened despite recording $119.8 billion in revenue.
Capital expenditure has become so large because of AI that it exceeded the cash Alphabet generated from its operations during the quarter. Free cash flow is calculated by subtracting capital expenditure from operating cash flow. In this instance, it result in a negative free cash flow.
That doesn’t mean Alphabet’s is losing money. It means the company is currently investing cash faster than it is generating it.
Source: Semafor
Alphabet needs to invest heavily in AI infrastructure. This means heavy investment today to reap the potential returns from AI tomorrow. There’s no guarantee that enough returns will come from this investment. That’s why markets are getting nervous about the large sums being invested in AI infrastructure.
Paid subscribers get access to the other four charts: default-insurance costs for AI-heavy tech groups, US data-centre sites, renewable electricity contracts and Intel’s foundry question. Together, they show how AI spending is becoming visible in credit markets, local infrastructure, power procurement and chip accounts.
