


For $10 a month, or $100 a year, you support a simple mission: spread great data visualisation wherever it comes from. You help fund the work of finding, sourcing and explaining the charts that deserve a wider audience. And you back a publication built on generosity, transparency and the belief that better understanding makes a better world.
CHART 1 • Data centres meet strong political opposition
One of the biggest takeaways from this mid-term election was the significant opposition to data centres. Data centres were on 47 ballot measures across 10 states, and they lost 46 times. In Ohio alone, there were 15 measures to ban, slow or cap the size of data centre development.
What’s shocking is that, politically, data centres are now more toxic as a subject than a nuclear reactor. A March Gallup poll found that 71% of Americans opposed building an AI data centre in their area, compared with 53% for a nuclear power plant. What this shows is that, in the years ahead, local political opposition might become a greater constraint on the AI boom than federal action.
What is the impact of the data centre development? Goldman Sachs estimates that short-term moratoriums could affect 45% of planned US data centre expansion.
On the upside, companies that have spare computing capacity would benefit if there is a restriction on data centre construction. A slowdown in data centre build-out could also benefit an overheating US economy. It could ease inflation pressure on electricity and other inputs and remove the need for the Federal Reserve to tighten policy further.
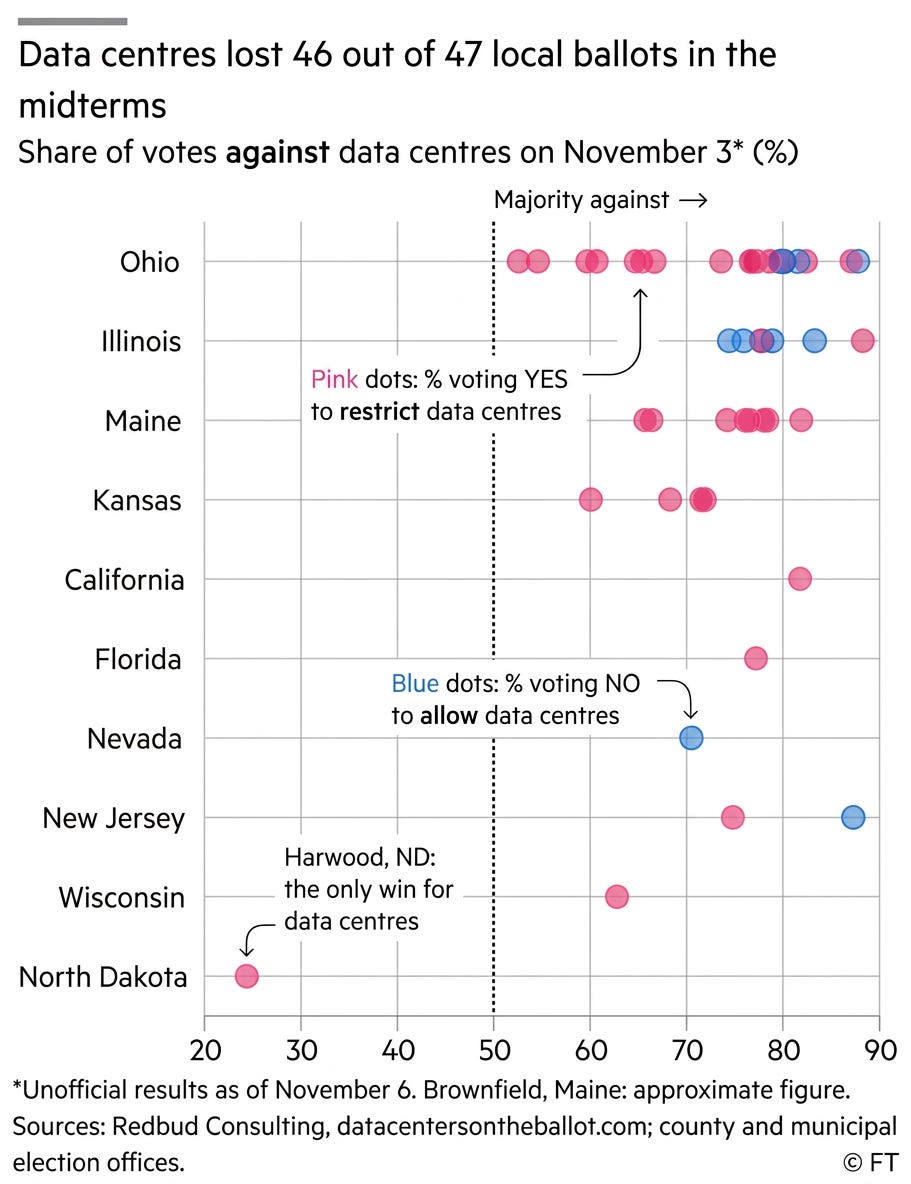
Source: Financial Times
Paid subscribers get access to the other four charts: China’s emissions, UK migration, purchasing-power wages and the world’s longest place names. Together, they show how geography, definitions and local choices change the meaning of a global comparison.
