
Could the US yield curve be about to rapidly steepen?
Five charts to start your day


When we talk about the "spread" between the 10-year and 2-year bonds, we're measuring whether the yield curve is inverted (short-term rates higher than long-term ones). This is often seen as a warning signal for an upcoming recession.
However, the real warning comes when the yield curve begins to "steepen" again rapidly after being inverted. This re-steepening has frequently occurred just before or during a recession, as you can see in the chart below
The steepening is often a result of the US Federal Reserve lowering short-term rates to address economic challenges, but it usually comes too late to avoid the recession that follows. This pattern repeated itself during the Covid-19 pandemic and might play out again now, as the yield curve has recently started to steepen after an extended inversion.
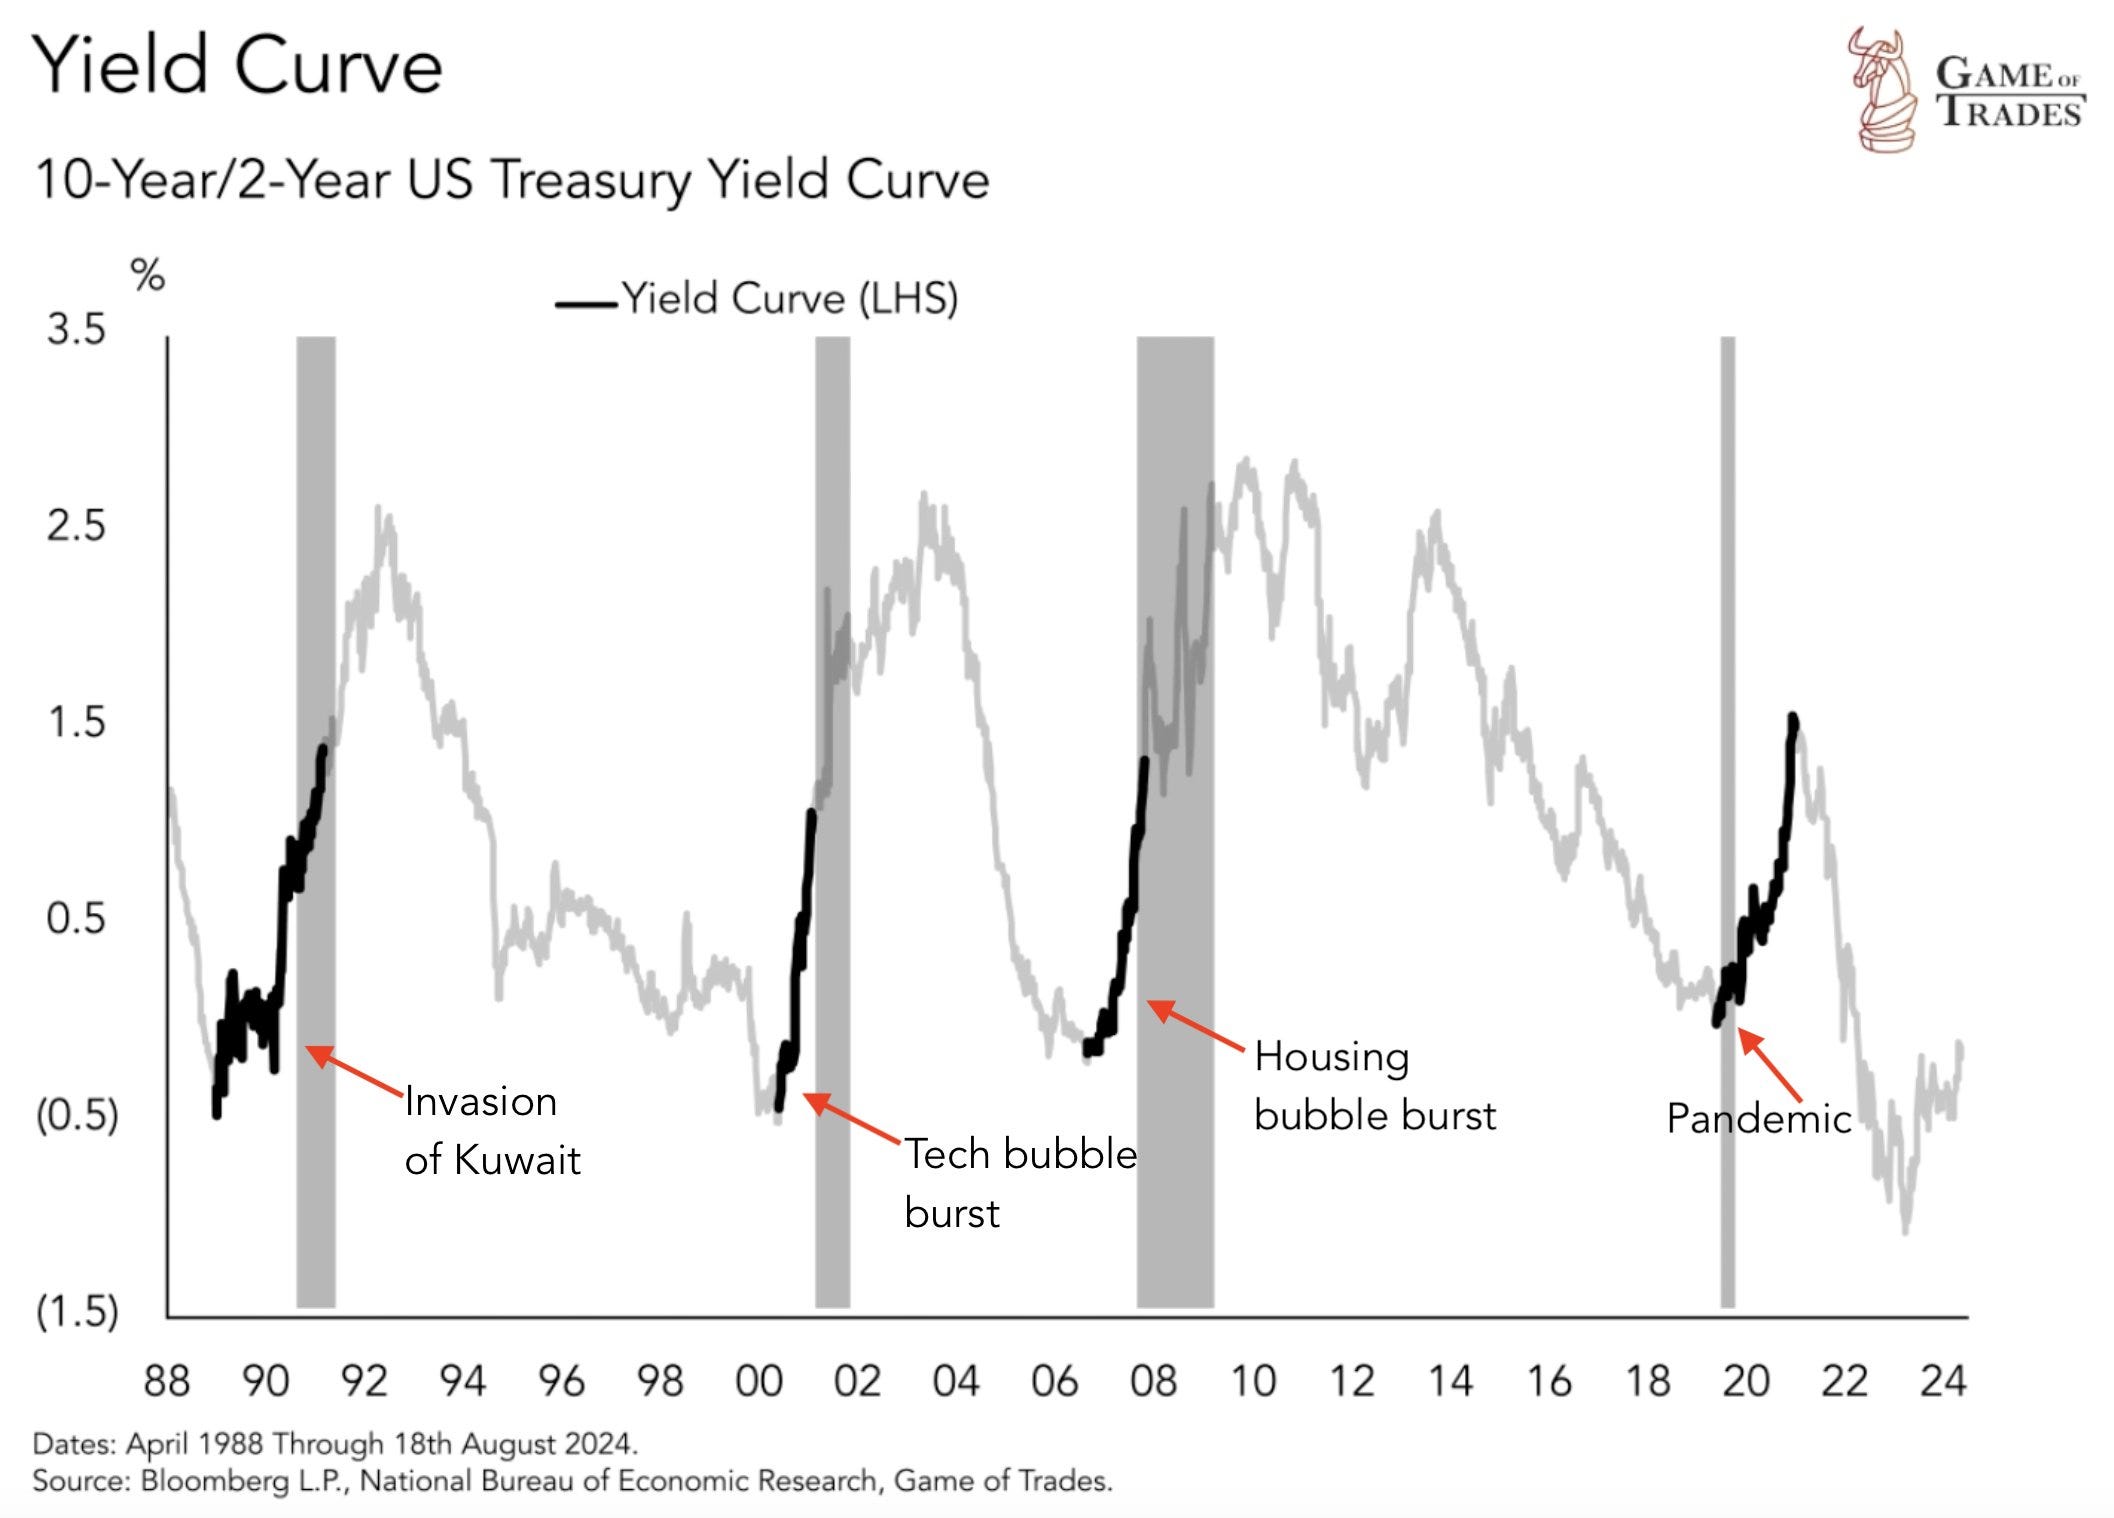
Source: Game of Trades
Coming up:
Investors are pulling out of multi-manager hedge funds
China’s exports remain strong
US inflation falls to 2.5% in August
Visualising wealth by country
If you like the sound of that line up, this is usually a paid newsletter. You basically get all my best ideas daily. Hit the subscribe button if you are interested and this will be sent to your inbox daily.
